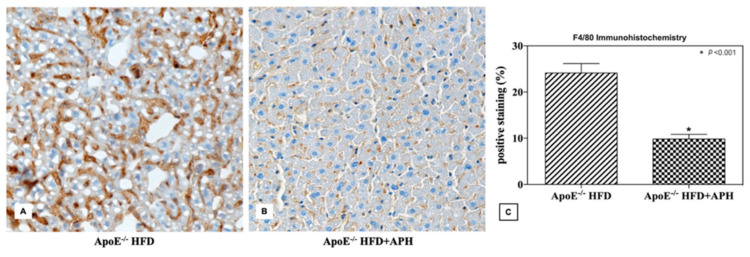
Figure 6.
Representative liver sections (A,B) and quantification (% of positive stained area) of F4/80 immunohistochemistry (C). ApoE–/–mice fed a HFD showed a statistically significant threefold increase in F4/80 expression levels (24.14 ± 2.04%) compared to ApoE–/– mice fed with a APH diet (9.81 ± 1.03%) (p < 0.001). Data are presented as mean ± SD for n = 6 mice per group (Scale bar, 50 µm). Abbreviations: HFD high-fat diet, APH anchovy protein hydrolysates.

