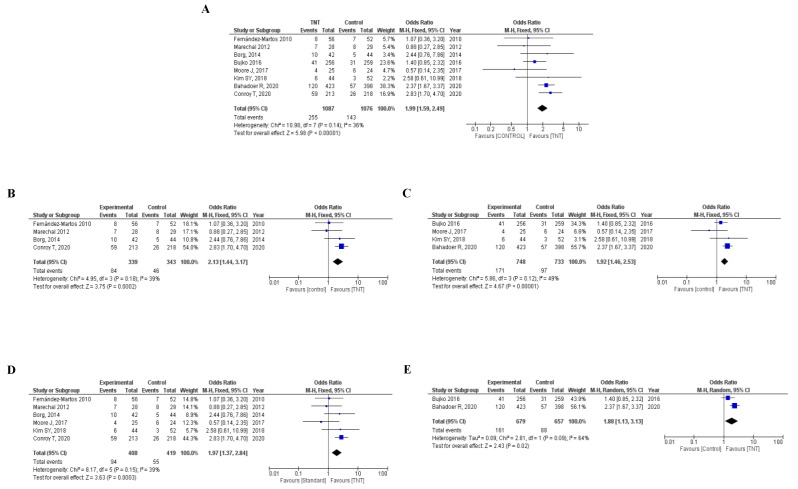
Figure 2.
(A) Forest plot for pathologic complete response of TNT vs. standard treatment. Forest plot for pathologic complete response of TNT vs. standard treatment using: (B) induction chemotherapy in the experimental arm; (C) consolidation chemotherapy in the experimental arm; (D) long-course chemo-radiotherapy in the experimental arm; (E) short-course radiotherapy in the experimental arm. CI: confidence interval, OR: odd ratio, TNT: total neoadjuvant therapy.

