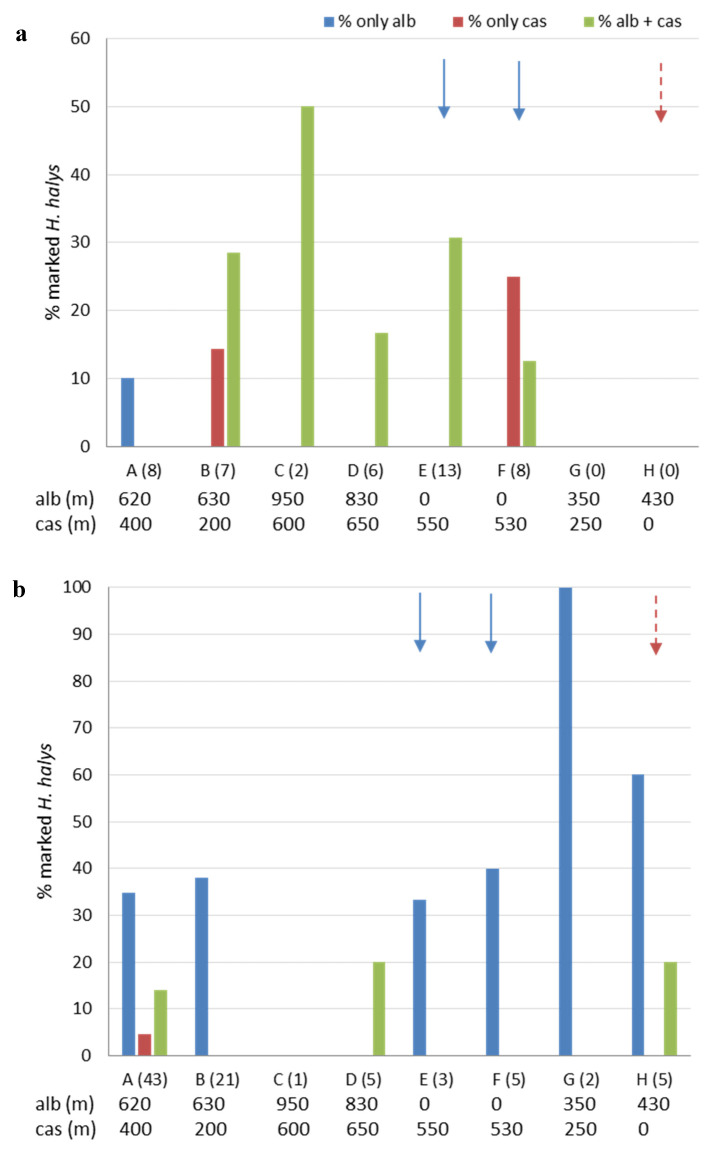
Figure 7.
Total percentages of marked Halyomorpha halys adults collected in the sampling zones (A–H) of Area 3 from 5 April to 27 April (a) and from 28 April to 30 May (b). On the x-axes for each zone the total number of tested specimens is given in brackets. For each zone, the distance (meters) from the treatment site is also indicated either for albumin (“alb”) or casein (“cas”). Arrows designate the zones in which treatments with casein (dashed dark red arrow) and albumin (blue arrow) were applied.

