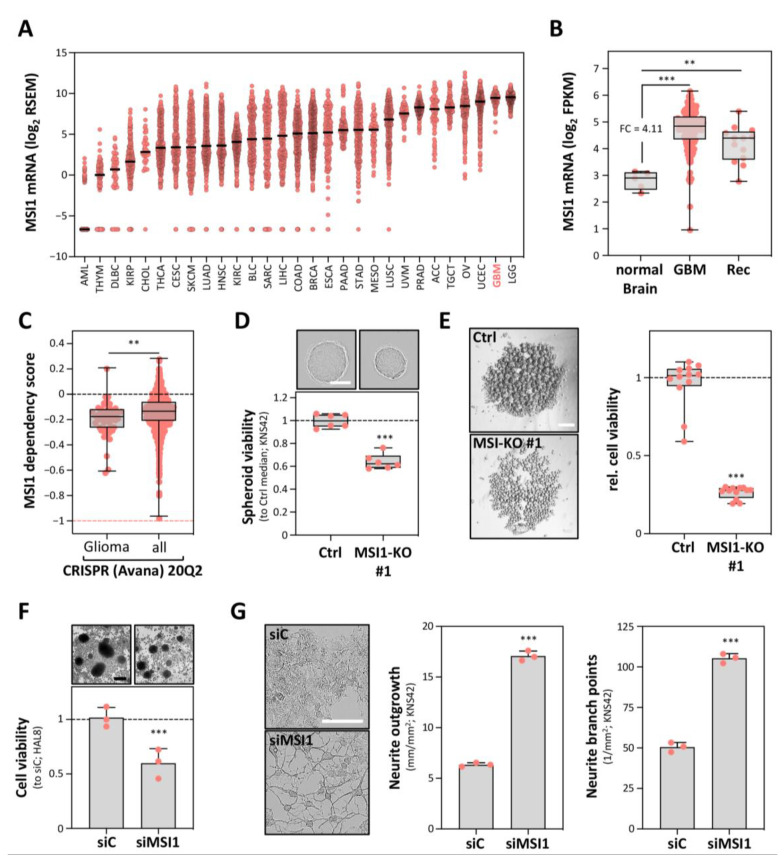
Figure 1.
Musashi1 (MSI1) conveys a pro-oncogenic role in glioblastoma (GBM)-derived cells. (A) Scatter plot presentation of MSI1 mRNA expression in all TCGA cohorts, provided by cBioPortal. (B) Box plot presentation of MSI1 mRNA expression for primary GBM and paired recurrence (Rec) samples, compared to normal brain tissue, derived from TCGA. (C) Box plot presentation of MSI1 dependency scores, determined for glioma-derived cell lines and for all provided cell lines from the DepMap database (Avana 20Q2). Dashed line (salmon) indicates the essentiality threshold. (D) Spheroid viability of the Cas9-only transfected (Ctrl) and MSI1 knockout cell clones (n = 6 per condition) as in (Figure S1B,C), determined by CellTiter-GLO, 72 h after seeding. Upper panel, representative images of the spheroids; scale bar, 150 µm. Lower panel: box plots showing the spheroid viability normalized to the median viability of the Cas9-only transfected cell clone (set to one). (E) Anoikis resistance of the Cas9-only transfected (Ctrl) and MSI1 knockout cell clones (n = 12 per condition) 7 days after seeding. Left panel, representative images of the cell aggregates; scale bar, 300 µm. Right panel, box plots showing the cell viability as determined in (D). (F) Relative cell viability for the siC- and siMSI1-transfected primary tumorspheres (HAL8), determined by CellTiter-GLO, 72 h post-transfection. Upper panel, representative images of the primary tumorspheres; scale bar, 150 µm. Lower panel, box plots showing the relative cell viability, normalized to the median of the siC-transfected cells (set to one). (G) Neurite growth parameters for the siC- and siMSI1-transfected KNS42 cells, 72 h post-transfection. Left panel: representative images of the KNS42 cells. Middle and right panels, quantification of the neurite outgrowth and branch points. Error bars indicate the standard deviation from at least three independent experiments. Statistical significance was determined by Mann–Whitney tests (B,C) and Student’s t-tests (D–G) (***, p ≤ 0.001; **, p ≤ 0.01).

