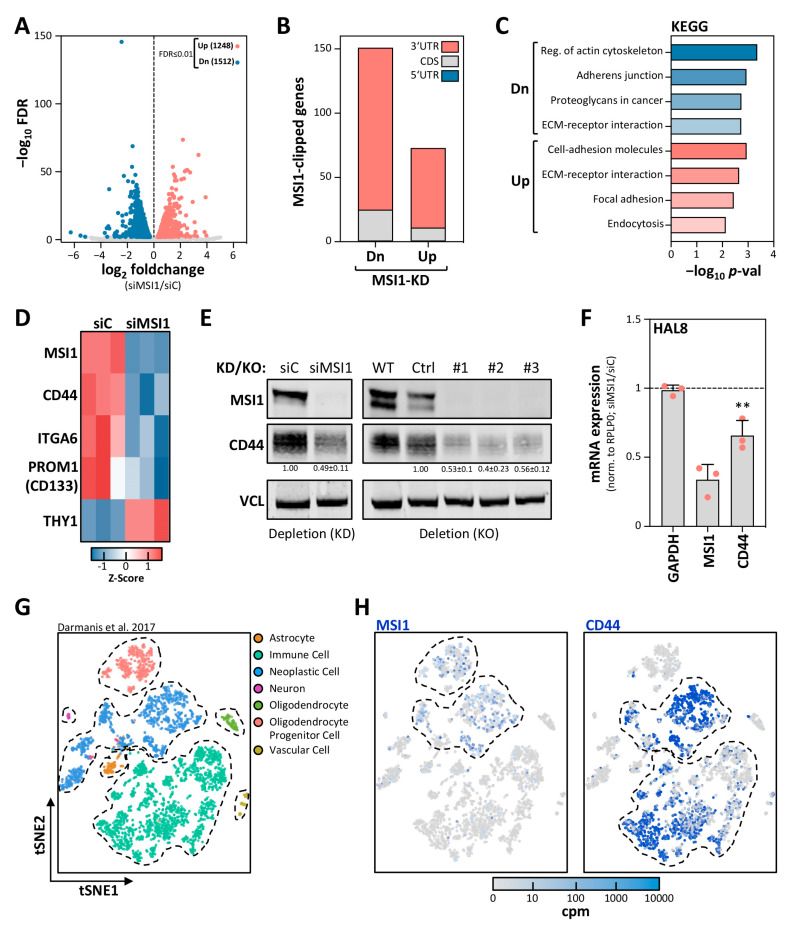
Figure 2.
MSI1 promotes CD44 expression in GBM-derived cells. (A) Volcano plot of the mRNA fold changes plotted against the FDR for siMSI1 versus siC in KNS42 cells, determined by mRNA-seq. Significantly differentially expressed genes (FDR ≤ 0.01) are highlighted in blue (downregulated) and red (upregulated). Numbers of differentially expressed genes are indicated. (B) The association of MSI1 protein with mRNA cis-elements, determined by CLIP [12], of significantly down- or upregulated genes (FDR ≤ 0.01) upon MSI1 depletion as in (A) is depicted. (C) KEGG analyses performed on all genes identified to be clipped in (B), by using Enrichr [25]. (D) Heatmap presentation depicting the expression of significantly differentially expressed (FDR ≤ 0.01) CSC marker genes (as in Figure S1E) in KNS42 cells, generated with Heatmapper [29]. (E) Representative Western blot analysis of indicated proteins of siC- and siMSI1-transfected KNS42 cells. VCL served as the negative and loading control. (F) Relative mRNA expression determined by RT-qPCR for the indicated transcripts upon transient MSI1 depletion in the primary tumorspheres HAL8, 72 h post-transfection. (G,H) 2D-tSNE analysis presentation of all single cells included in the study (n = 3589) by Darmanis et al. (2017) [3,28]. Distinct identified types of cell clusters are indicated (G). MSI1 and CD44 expression levels are indicated for each single cell in increasing shades of blue, as indicated by a color code (H). Error bars indicate the standard deviation from three independent experiments. Statistical significance was determined by Student’s t-test (**, p ≤ 0.01).

