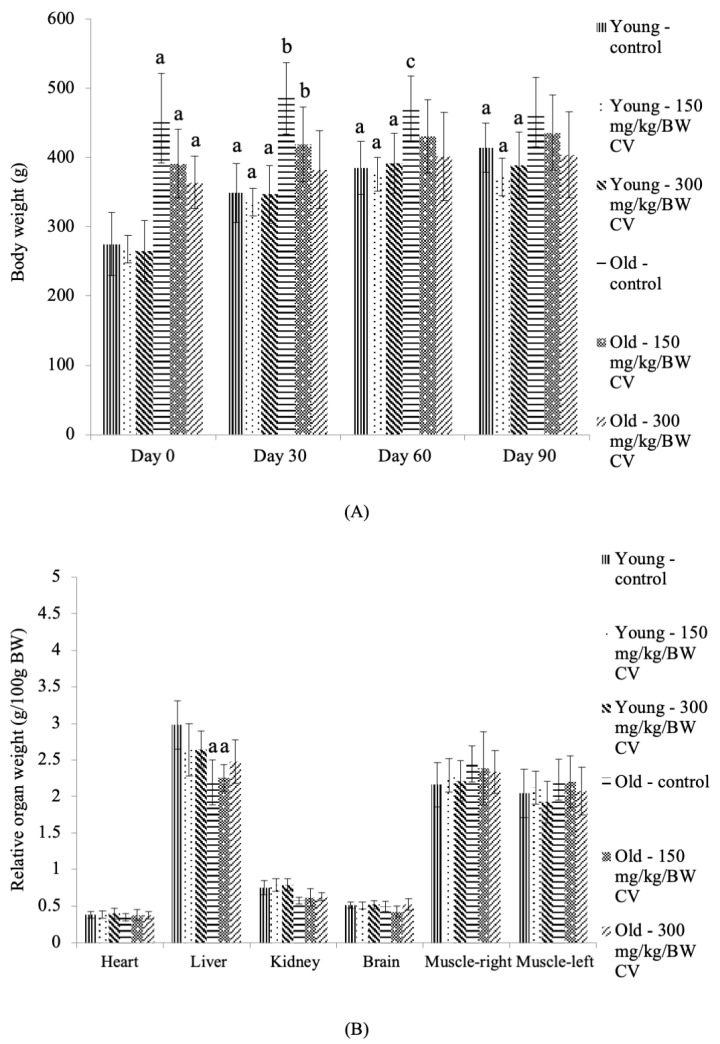
Figure 1.
The (A) body weight and (B) relative organ weight of the young and old rats. The data are presented as the mean ± SD, n = 8 (control rats), n = 10 (C. vulgaris-treated rats). a p < 0.05 significantly different compared to the control young rats on Day 0, b p < 0.05 significantly different compared to the control young rats on Day 30, c p < 0.05 significantly different compared to the control young rats Day 60, with a post hoc Tukey HSD test. BW: Body weight; CV: C. vulgaris.

