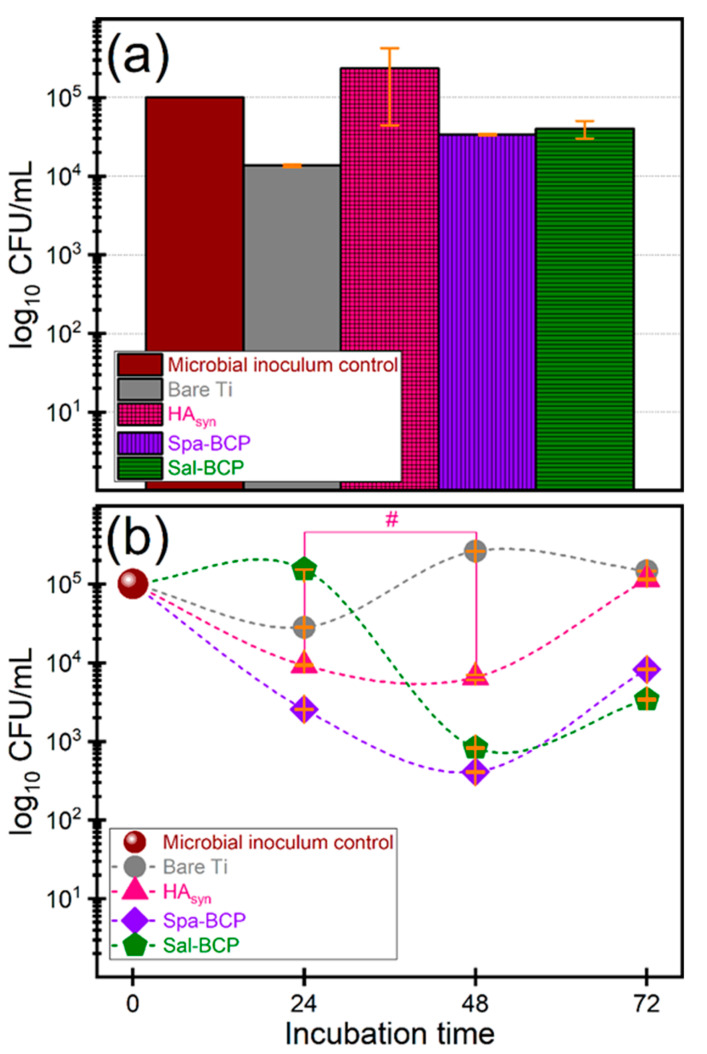
Figure 10.
Logarithmic representation of colony forming units (CFU)/mL of the E. coli bacterial strains, depicting the (a) initial stages of microbial adhesion (10–15 min) and (b) microbial growth and biofilm development after different time intervals (of 24, 48 and 72 h, respectively), in the presence of the bare Ti substrates and PLD coatings of HAsyn, Spa-BCP, and Sal-BCP. Note: # p > 0.05, thereby, no statistically significant difference between HAsyn 24 h vs. HAsyn 48 h, as resulted based on a one-way ANOVA analysis followed by a Tukey-Kramer post-hoc test. For all other situations p < 0.05.

