Figure 2.
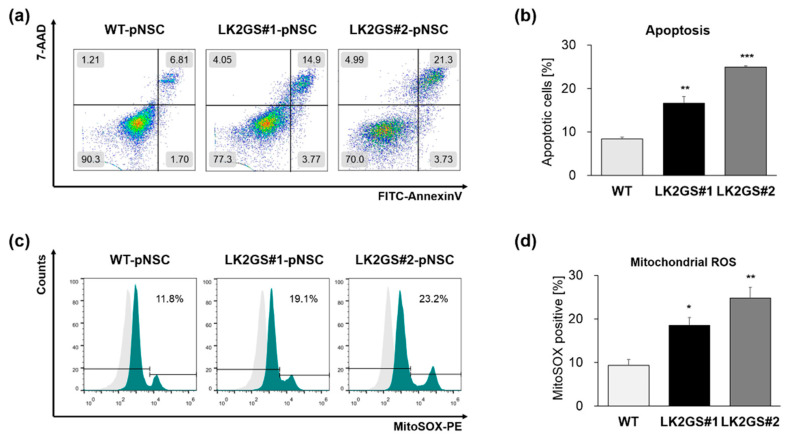
Functional characterization of LK2GS-pNSCs. (a) Detection of apoptotic cells by annexin V and 7-AAD staining. (b) Bar graph indicating the averages of annexin V positive populations. (c) Detection of mitochondrial reactive oxygen species (ROS) by the detection reagent MitoSOX Red. (d) Bar graph indicating the averages of MitoSOX Red positive populations. Results are means ± standard error of mean (S.E.M) for three independent experiments. * p < 0.05, ** p < 0.01, *** p < 0.001.

