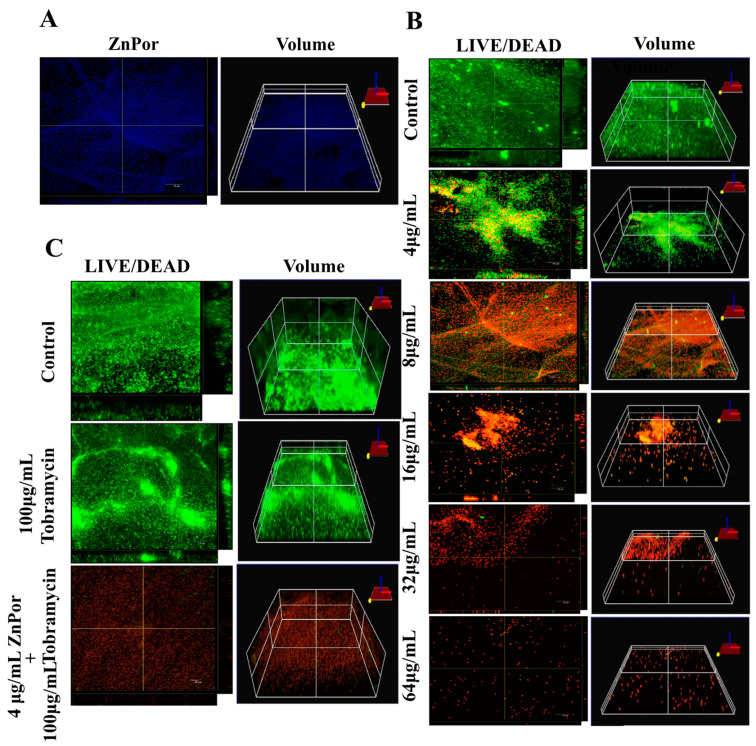
Figure 2.
The effect of ZnPor on PsA biofilms: These experiments used confocal microscopy to image PsA biofilms formed on polyethylene coupons in Center for Disease Control (CDC) -approved bioreactors for 16–18 h. (A) ZnPor (alone)-stained biofilm. Biofilm was incubated in 8 µg/mL ZnPor solution for 2 h. The distribution of ZnPor in the biofilm was imaged by ZnPor excitation/emission (433/620 nm, respectively). The 3D volumetric depth image shows ZnPor was distributed throughout the biofilm matrix. (B) LIVE/DEADTM staining and 3D volumetric depths of biofilms treated with concentrations of ZnPor from 4 to 64 µg/mL for 2 h followed by LIVE/DEAD staining. (C) LIVE/DEADTM staining of biofilms treated with 100 µg/mL of Tobra alone, or in combination with ZnPor (30 min pre-treatment (4 µg/mL)), for 2 h. Biofilm treated with ZnPor alone (4 µg/mL) is shown in panel B. Control refers to a biofilm that received no treatment. All graphs are representative of three independent experiments (n = 9). Length of size bar: 10 µm.

