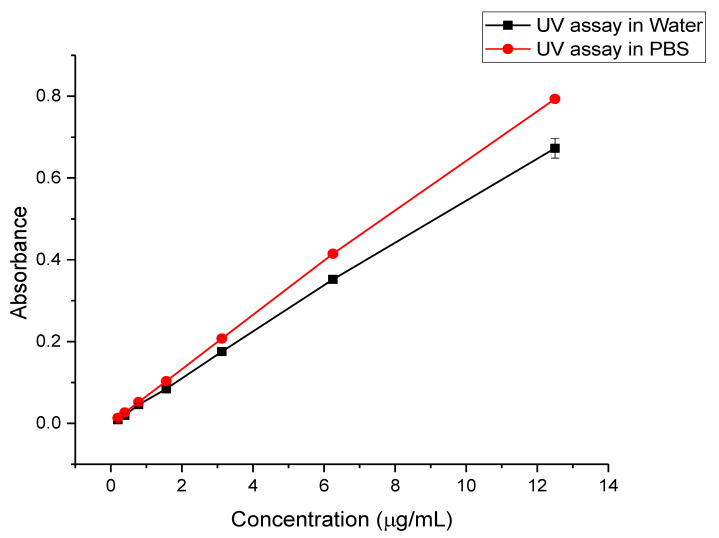
Figure 6.
Halicin UV calibration curves using deionized water (DW) (for drug loading (DL) determination) and phosphate buffer saline (PBS) pH 7.4 (for the release study). Both curves showed good linearity at a concentration range of 12.5 to 0.2 μg/mL, with the r2 of 0.9994 and 0.9995 for DW and PBS, respectively.

