FIGURE 3.

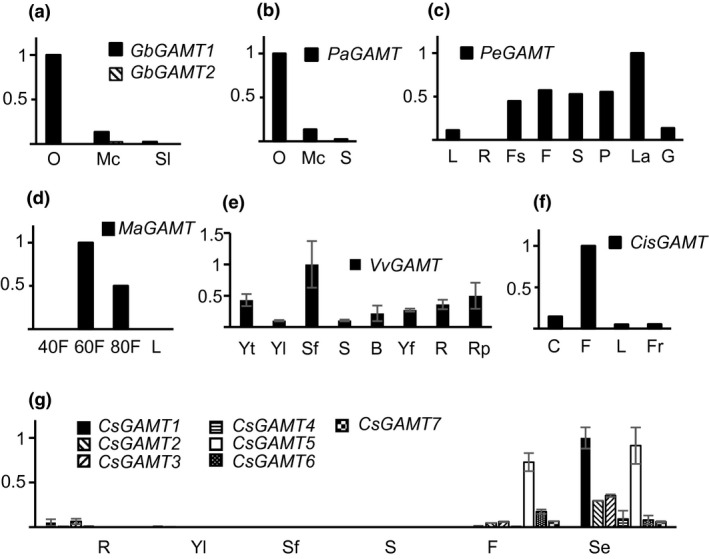
Expression patterns of GAMT genes in selected species based on their expression data in public sources. (a) GbGAMT1 and GbGAMT2 from Ginkgo biloba; (b) PaGAMT from Picea abies; (c) PeGAMT from Phalaenopsis equestris; (d) MaGAMT from Musa acuminata; (e) VvGAMT from Vitis vinifera; (f) CisGAMT from Citrus sinensis; (g) CsGAMT1 to CsGAMT7 from Camelina sativa. O, ovules; Mc, male cones; Sl, dtem and leaves; S, stem; L, leaf; R, root; Fs, floral stalk; F, flower; S, sepal; P, petal; La, labellum; G, gynostemium; 40F, 40‐day‐fruit; 60F, 60‐day‐fruit; 80F, 80‐day‐fruit; Yt, young tendril; Yl, young leaf; Sf, senescent leaf; B, bud; Yf, young flower; Rp, ripening pericarp; C, callus; Fr, fruit; Ro, rosette; Cl, cauline leaf; Se, seed. The highest level of expression in each species was arbitrarily set at 1.0. Standard deviations were marked with error bars in (e) and (g), not in other figures due to lack of such information
