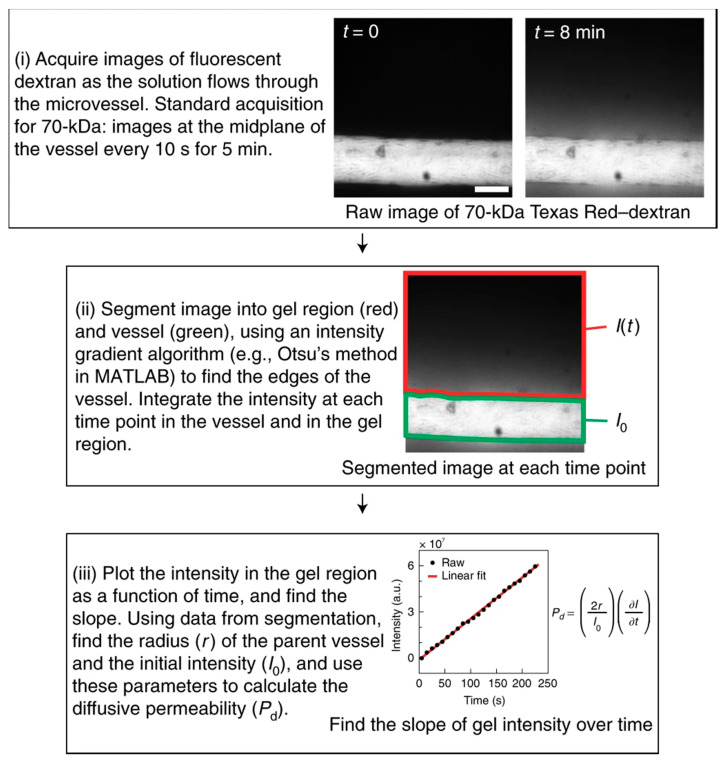
Figure 6.
Quantifying the diffusive permeability of vessels in the human-engineered microvessel platform. (i) Images are taken in time-lapse to follow the flux of 70 kDa dextran. After 8 min, an image shows the diffusion of the dextran molecules into the collagen gel. The frequency and number of images necessary need to be optimized for each molecule and experimental condition. Scale bar = 70 µm. (ii) Next, the images are segmented into the gel region I(t) in red and the vessel region I0 in green. I(t) is the gel intensity to be measured and compared to the initial intensity I0 in the vessel. (iii) The intensity I(t) of dextran plotted as a function of time is used to determine Pd, the diffusive permeability of the vessel. Reproduced with permission from [183]. Copyright Springer Nature, 2019.

