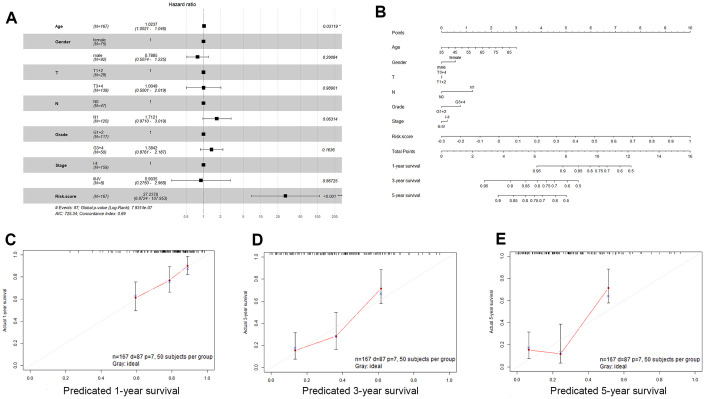
Figure 6.
Validation of the nomogram in predicting overall survival of pancreatic cancer in the TCGA dataset. (A) Forest plot summary of multivariable Cox regression analyses of the risk score, age, sex, grade and tumor stage in the TCGA cohort. The squares represent the hazard ratio (HR), and the transverse lines represent 95% CIs. CI, confidence interval. (B) A nomogram to predict survival probability at 1, 3 and 5 years for PDAC patients based on the results derived from the TCGA cohort. (C–E) Calibration curve for the nomogram when predicting 1, 3- and 5-year overall survival.

