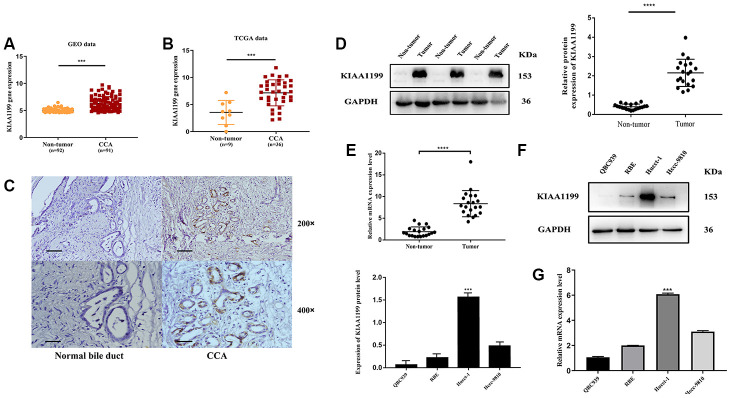
Figure 1.
Bioinformatics prediction. (A) GEO: (GSE76297), Normal: n=92, CCA: n=91, (p<0.001). (B) TCGA database, Normal: n=9, CCA: n=36, (p<0.001). Protein and mRNA expression of KIAA1199 in CCA tissues cell lines (C) The relative expression levels of KIAA1199 in Pathological sections. (D) The relative protein expression levels of KIAA1199 in 20 pairs of CCA and adjacent normal tissues(p<0.001). (E) The relative mRNA expression levels of KIAA1199 in 20 pairs of CCA and adjacent normal tissues(p<0.001). (F, G) The relative protein and mRNA expression of KIAA1199 in four CCA cell lines.>

