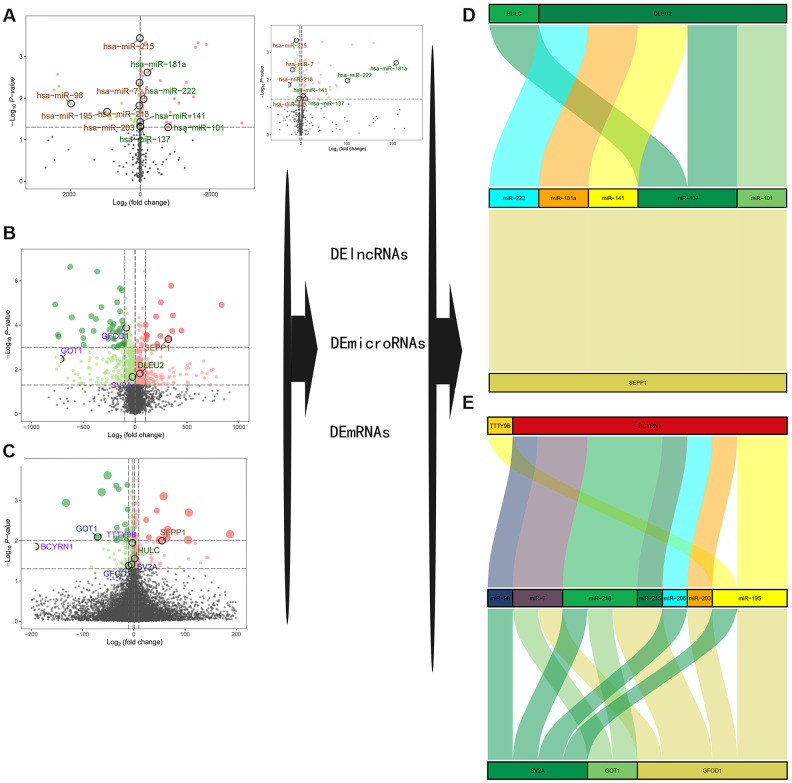
Figure 3.
(A–C) A volcano plot of GSE23527 with 886 miRNAs, of which 100 were either up- or down-regulated. (B) A volcano plot of GSE1428 with 12427 RNAs; 1232 RNAs and lncRNAs were identified either up- or down-regulated. (C) A volcano plot of GSE52699 with 34663 RNAs; 637 RNAs were identified either up- or down-regulated. Note: the red dots represent the upregulated genes, the green dots represent the downregulated genes, and the black dots represent the genes that are not significantly differentially expressed in old muscle samples. (D, E) A ceRNA network for sarcopenia.

