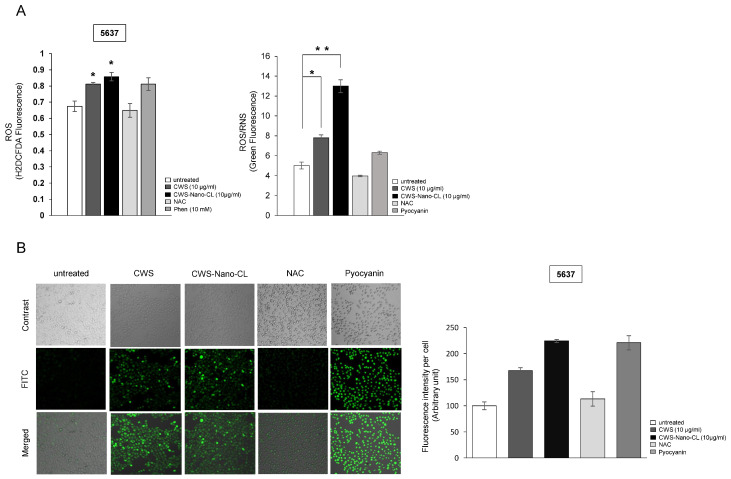
Figure 4.
Effect of CWS-loaded formulations on reactive oxygen species (ROS) production in bladder cancer cells. (A) Cells were treated with 10 μg/mL of CWS or CWS-Nano-CL for 24 h and then treated with NAC (2 mM, positive control) for 30 min. After washing, cells were treated with H2DCFDA (10 µM) for 1 h prior to measurement. ROS/RNS production was measured using a ROS-ID® ROS/RNS detection kit. Pyocyanin (500 µM) and NAC (5 mM) were added as a positive and a negative control for 30 min. * p < 0.005, ** p < 0.0005; untreated/CWS or untreated/CWS-Nano-CL. Data are mean ± SEM (n = 6). (B) Fluorescence images of ROS/RNS production in live cells were taken using a confocal microscope (Leica DMI8) and quantified with the ImageJ software program (lower panel). Data are mean ± SEM (n = 3).

