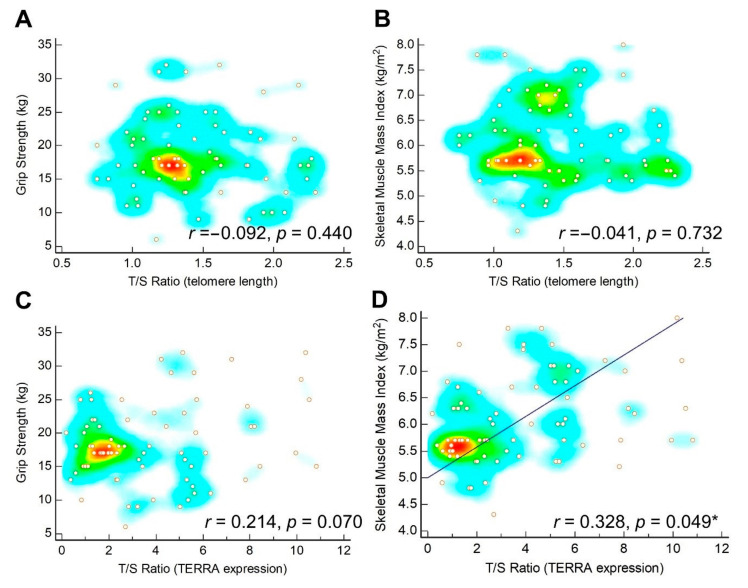
Figure 2.
Scatter plots for correlation (A) between telomere length and grip strength, (B) between telomere length and skeletal muscle mass index, (C) between expression of telometric repeat–containing RNA (TERRA) and grip strength, and (D) between TERRA expression and skeletal muscle mass index. The regression line is plotted when p < 0.05. The heat map with background color coding suggests clusters of observations. * denotes p < 0.05.

