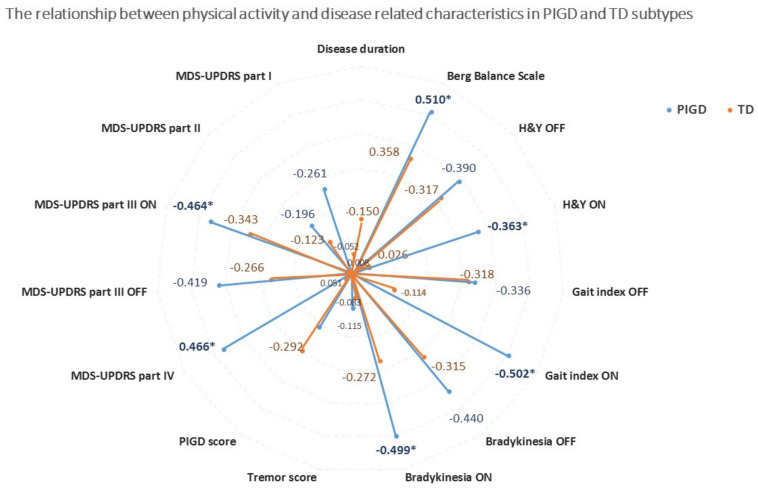
Figure 2.
The relationship between total daily-living physical activity and disease-related measures in PIGD and TD subtypes. Blue indicates PIGD and orange indicates TD. The values represent the Spearman partial correlation coefficient (rS) controlling for age, sex, and BMI. The correlation coefficients are presented as absolute values. * p-value statistically significant (p < 0.004), even after adjusting for multiple comparisons using Bonferroni corrections.

