Figure 3.
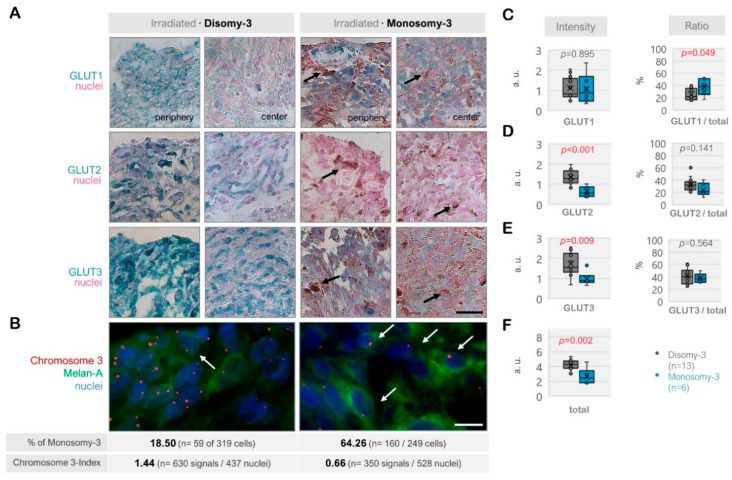
Expression of the glucose transporters GLUT1, GLUT2, and GLUT3 in the irradiated uveal melanoma (UM) samples. (A) Representative images from the immunohistochemistry for GLUT1-3. The disomy-3 tumor originates from a male patient (60 years), who remained metastasis-free during the follow-up, whereas the monosomy-3 tumor was obtained from another male patient (52 years), who has developed liver metastases. Irradiation was performed two months prior to the acquisition of both tumors. Images were collected at an original magnification of 200×. Arrows indicate varying degrees of pigmentation. Scale bar = 25 μm. (B) Immuno-Fluorescent in situ hybridization (Immuno-FISH) analysis, demonstrating the copy number of chromosome-3 (red) in the UM cells that were expressing the melanoma marker Melan-A (green). The nuclei were counterstained in blue with DAPI. Arrows indicate several cells with monosomy-3. The percentage (%) of monosomy-3 cells and the chromosome index of these tumors were presented underneath the respective images (please see the Methods for the detailed description of the calculation of these parameters, n: number). Scale bar = 10 μm. Quantification of the intensity and ratio of (C) GLUT1, (D) GLUT2, and (E) GLUT3 in the irradiated primary UMs with regard to the monosomy-3 status. (F) The sum of the GLUT1-3 intensities was presented as “total.” p-values were determined by the unpaired, two-sided t-test. The significant p-values (<0.05) were highlighted in red. a.u.: Arbitrary units.

