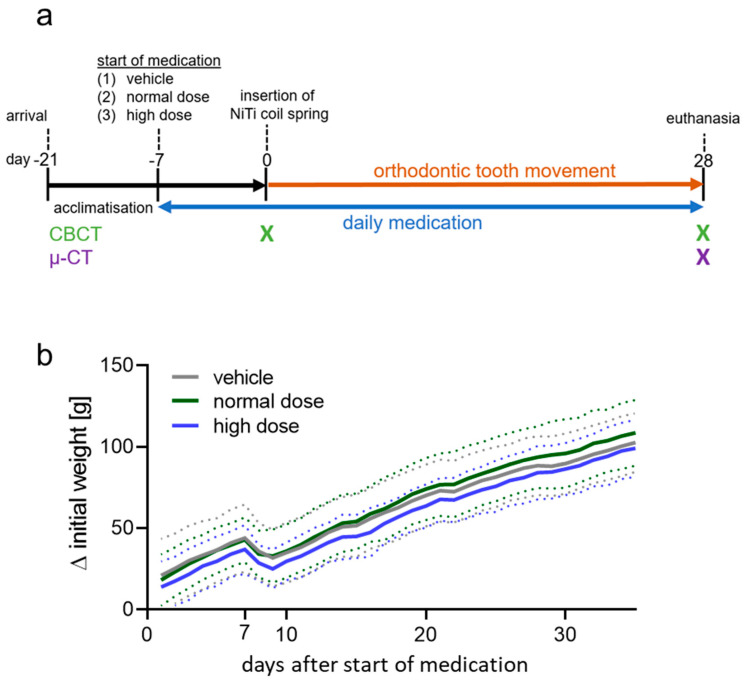
Figure 1.
(a) Experimental time-flow chart of the animal experiment. (b) Weight difference to initial gross body weight of rats treated with tap water (vehicle), normal or high dose cetirizine. Solid line: mean values; dashed line: standard deviation. n ≥ 19. Statistics: Welch-corrected ANOVA followed by Games–Howell multiple comparison tests.

