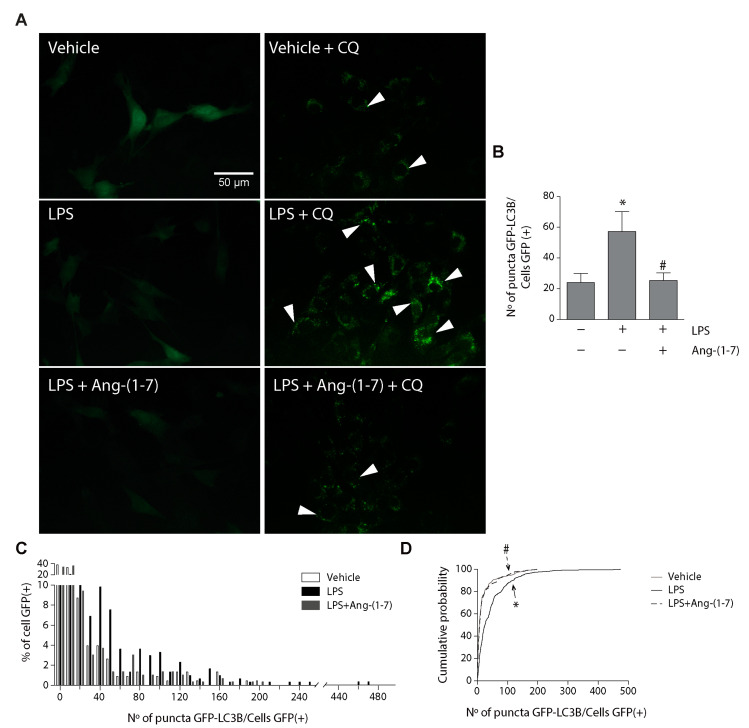
Figure 4.
Ang-(1-7) reduced the LPS-induced LC3II/LC3I ratio and autophagic flux in C2C12 myotubes. C2C12 cells were pre-treated with or without Ang-(1-7) (1, 10, and 100 nM) for 30 min and then incubated in the absence or presence of chloroquine (CQ; 50 μM) for 5 min. Next, the cells were treated with the vehicle, LPS (500 ng/mL), or LPS + Ang-(1-7) for 8 h. Then, we evaluated LC3I and LC3II protein levels through Western blot (A). GAPDH levels are shown as loading control. Molecular weight markers are depicted in kDa. The quantitative analysis of the experiment is shown in (B). The results were represented as LC3II/LC3I ratio and expressed as the mean ± S.E. (the fold of change relative to the vehicle group). (C) The quantitative analysis of autophagic flux was conducted using densitometric analysis of LC3II obtained by the difference between the condition with and without CQ from the representative images shown in (A). The values were normalized to the vehicle condition and expressed as the mean ± S.E. (D) The cumulative probability distribution of autophagosomes (number of puncta) in transduced cells with Adv-GFP-LC3B incubated with CQ. Three independent experiments were conducted (*, p < 0.05 vs. vehicle. #, p < 0.05 vs. LPS). Plus (+) and minus (−) symbols indicated in the figures or graphics mean presence or absence of treatment. The white arrows are examples of autophagosomes.

