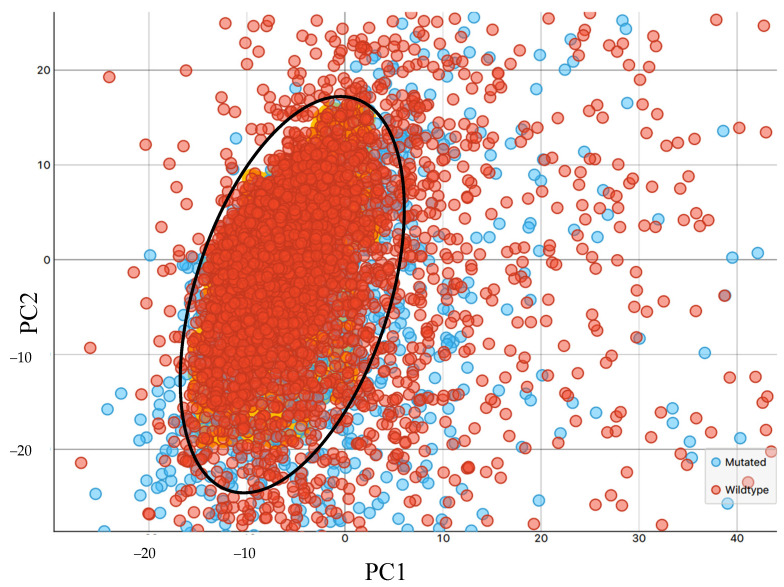
Figure 4.
Principal component analysis (PCA)-based quality test: PCA scores plot of principal component 1 (PC1) and principal component 2 (PC2) with focus on centre of the cluster highlighting the ellipse (black circle) containing the data that were carried forward for investigation; all spectral datapoints laying outside of the ellipse were removed from subsequent analysis.

