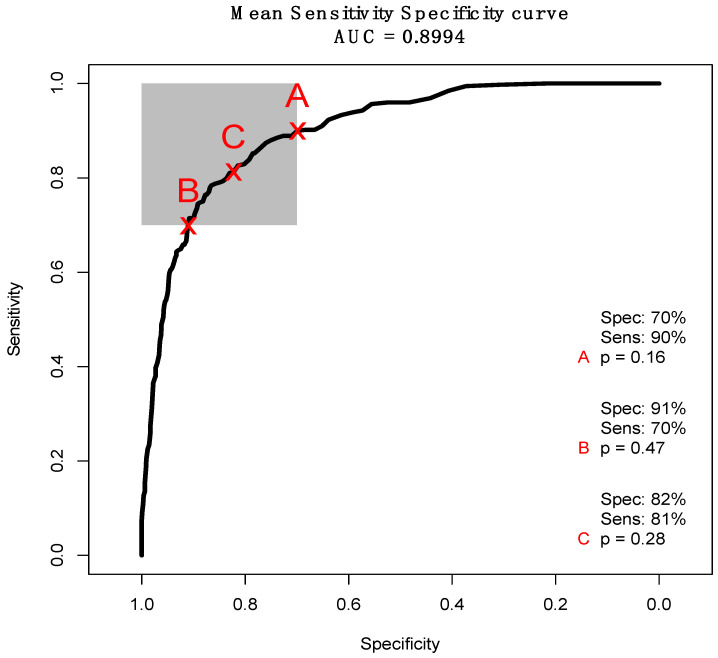
Figure 8.
Mean receiver operator characteristic (ROC) curve displaying the trade-off between sensitivity and specificity for 51 resampled linear discriminant analysis (LDA) classifiers. The grey square is a target region of at least 70% for both sensitivity and specificity. The ‘x’ labels are the points on the curve that maximise sensitivity (A), specificity (B) and balance the two (C) whilst remaining in the target area, and ‘p’ represents the probability thresholds at those points on the curve.

