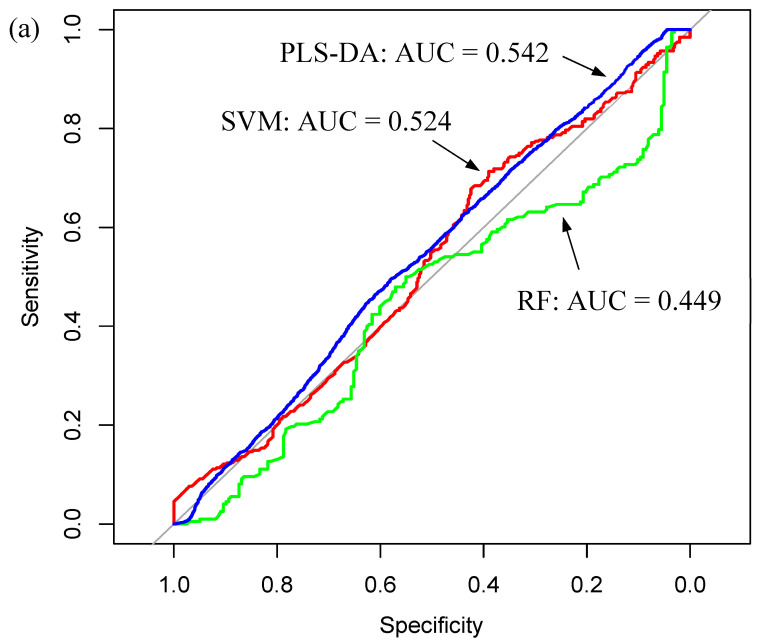
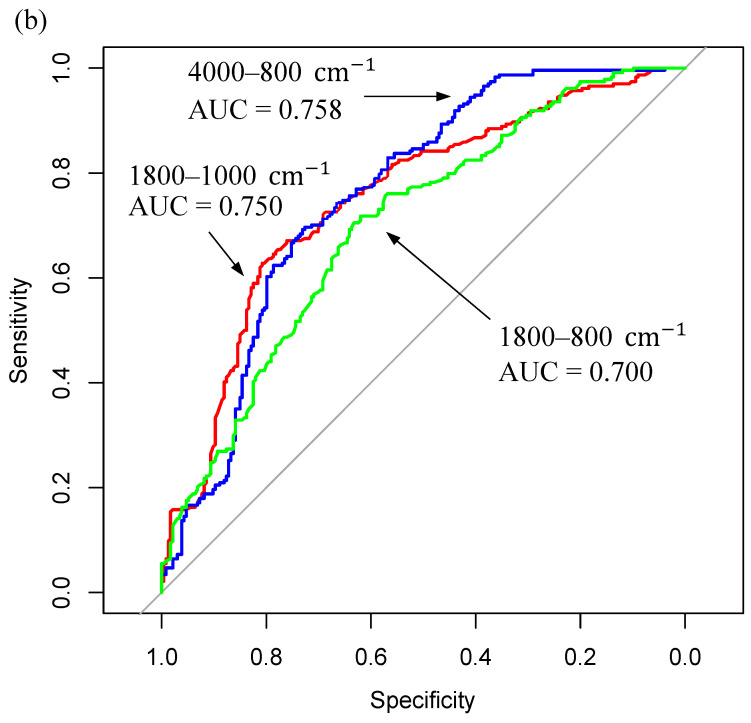
Figure 10.
Single model receiver operator characteristic (ROC) graphs for the (a) whole serum dataset displaying the PLS-DA (blue), SVM (red) and RF (green) classifiers; and (b) the best performing model for each of the tested filtrate fractions: the full spectrum (4000–800 cm−1, blue), the fingerprint region (1800–1000 cm−1, red) and the extended fingerprint region (1800–800 cm−1, green).


