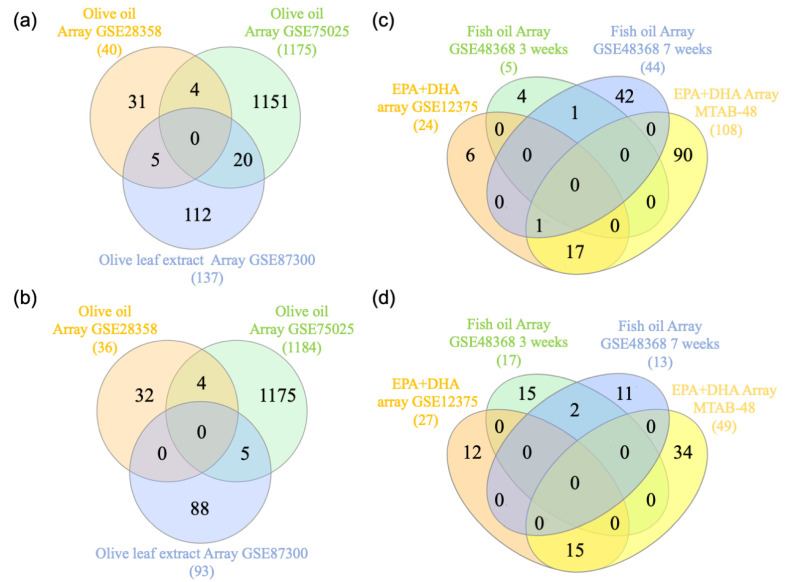
Figure 2.
Venn diagram analysis of the genes up and downregulated in olive- and omega-3-supplemented diets. (a) and (b). Genes in olive-supplemented diets: The genes downregulated (a) and upregulated (b) in the olive oil or leaf extracts arrays were downloaded from BSCE and used to create a Venn diagram using the following website http://www.interactivenn.net/. (c) and (d). Genes in Omega-3-supplemented diets: The genes downregulated (c) and upregulated (d) in the fish oil or eicosapentaenoic acid (EPA)/ docosahexaenoic acid (DHA) studies were downloaded from BSCE and used to create the Venn diagrams.

