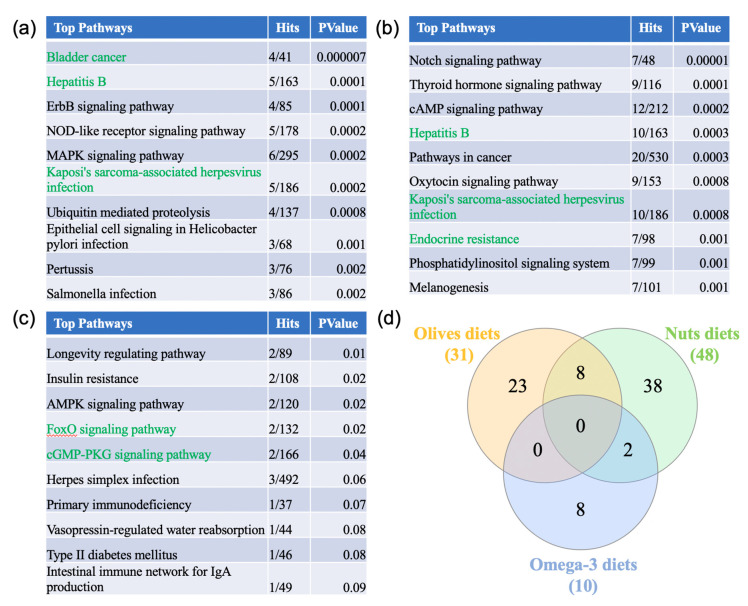
Figure 3.
Pathway analysis. (a–c) The genes differentially expressed in 2 out of 3 olive supplement arrays, in the nuts supplement array, in at least 2 out of the 4 arrays from fish or EPA + DHA diets were obtained using Venn analysis. The gene lists were uploaded to https://www.networkanalyst.ca/NetworkAnalyst/faces/home.xhtml, where a list enrichment network analysis was performed using the KEGG database. The 10 tops pathways identified from the olive-, nuts-, or omega-3-supplemented diets are listed in (a), (b), and (c) respectively. (d) The pathways shared between the three types of Mediterranean diets were analyzed in a Venn diagram analysis.

