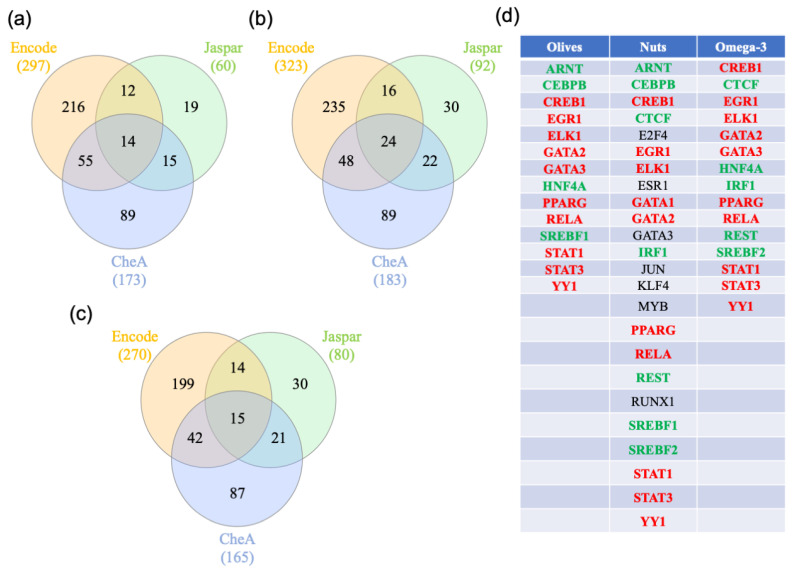
Figure 4.
Transcription factor analysis. (a–c) Transcription factor analysis for each diet. The gene lists were uploaded to https://www.networkanalyst.ca/NetworkAnalyst/faces/home.xhtml. The gene–transcription factor interaction network was performed with ENCODE, ChEA, and JASPAR, and (a), (b), and (c) represent the results of the Venn analysis performed with olive-, nuts- and omega-3-genes, respectively. The transcription factors interacting with the supplement-regulated genes are listed in (d). Transcription factors in red are shared between the three supplements, the transcription factors in green are shared between two supplements, and the transcription factors in black are unique to a supplement.

