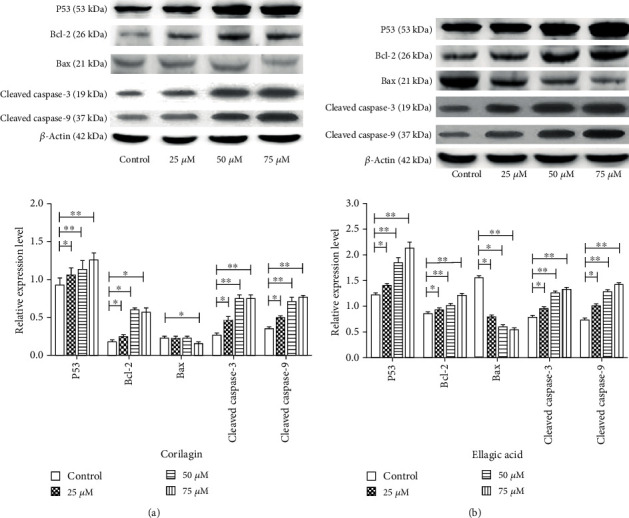
Figure 4.

Ellagic acid and corilagin induce the P53 signaling pathway in SiHa cells. Cells were treated with various concentrations of selected ellagic acid and corilagin of 25, 50, and 75 μM for 48 h, after which protein expression in total cells was assayed by Western blot analysis. (a) Ellagic acid-induced protein expression, (b) corilagin induced protein expression. The relative abundance of each band was quantified, and the control levels were set at 1.0 (lower panel). Data are expressed as percentage of control, in means ± SEM (n = 3).∗p < 0.05, ∗∗p < 0.01, compared with control.
