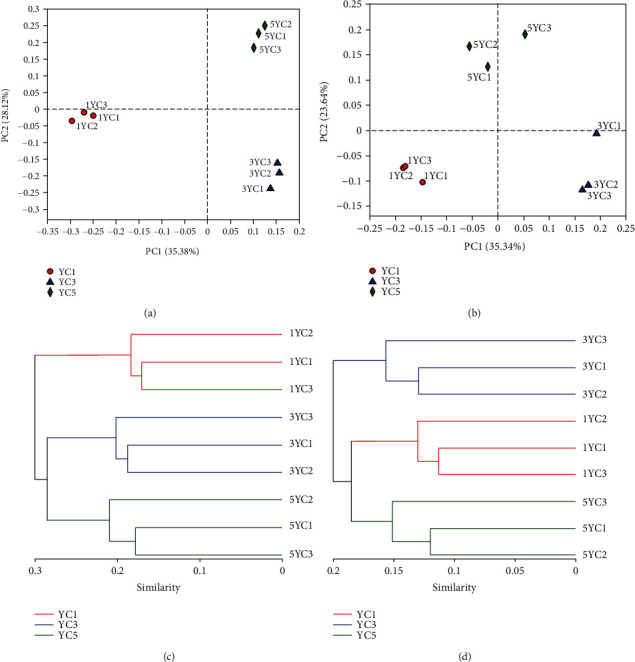
Figure 4.

Sample composition structure similarity and difference at the OTU level. (a) Fungal principal coordinate analysis plot based on the Bray-Curtis method; (b) bacterial principal coordinate analysis plot based on the Bray-Curtis method; (c) fungal clustering analysis plots based on the Bray-Curtis method; (d) bacterial clustering analysis plots based on the Bray-Curtis method. The three colours of red, blue, and green represent the three continuous cropping years (YC1, YC3, and YC5, respectively).
