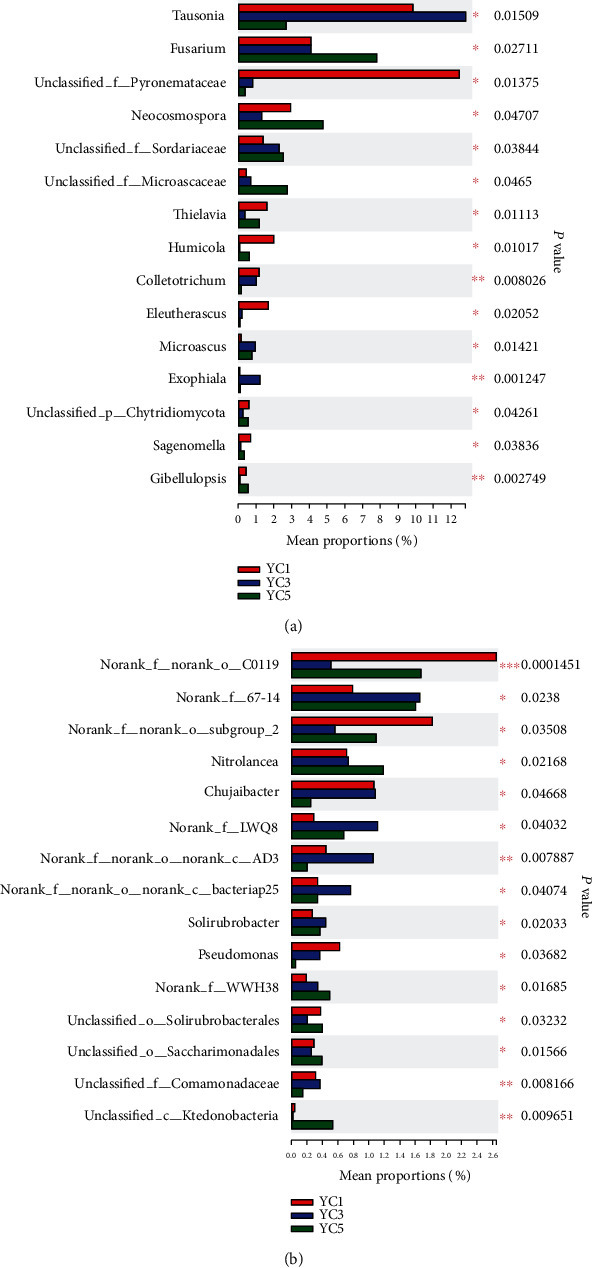
Figure 5.

The top 15 (a) fungal and (b) bacterial genera with significant differences. The y-axis represents the species name at a certain taxonomic level, p represents phylum, c represents class, o represents order, and f represents family. The x-axis represents the average relative abundance in different groupings of species, and the columns with different colours represent different group. Significant differences were identified by means of one-way ANOVA, and P values were corrected for multiple comparisons using the false discovery rate (FDR). The P value is on the right side; ∗0.01 < P ≤ 0.05, ∗∗0.001 < P ≤ 0.01, and ∗∗∗P ≤ 0.001.
