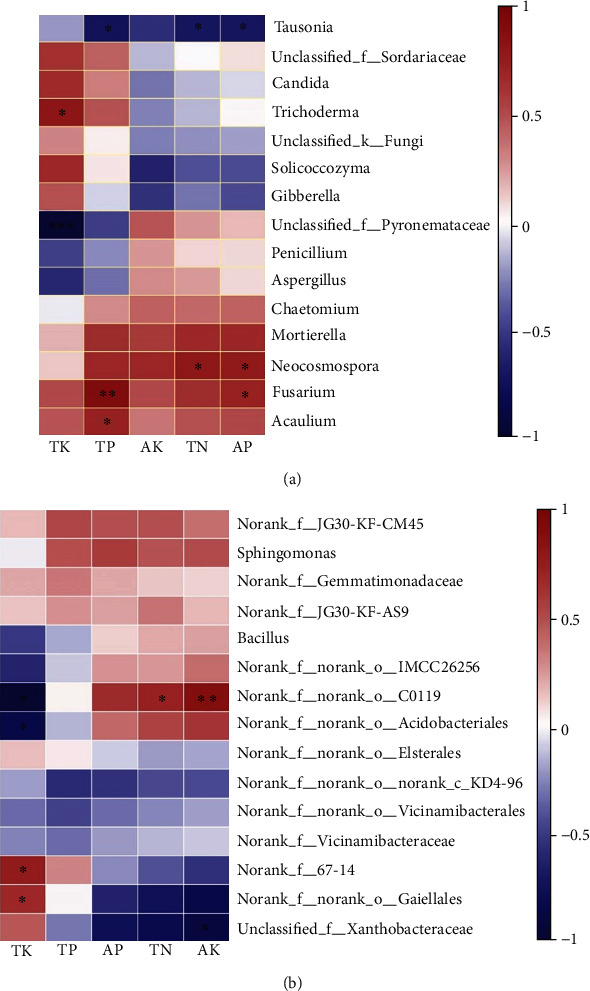
Figure 7.

Correlation heat map of microbial classification and environmental factors. (a) Correlation heat map of the top fifteen genera (fungi) and soil nutrient content. (b) Correlation heat map of the top fifteen genera (bacteria) and soil nutrient content. The x-axis and the y-axis are environmental factors and species, respectively. The R values are shown in different colours in the figure. The right legend is the colour range of different R values. Significant values are shown as ∗0.01 < P ≤ 0.05, ∗∗0.001 < P ≤ 0.01, and ∗∗∗P ≤ 0.001.
