. 2020 Dec 11;22(12):e23369. doi: 10.2196/23369
©Lauren Bell, Claire Garnett, Tianchen Qian, Olga Perski, Elizabeth Williamson, Henry WW Potts. Originally published in the Journal of Medical Internet Research (http://www.jmir.org), 11.12.2020.
This is an open-access article distributed under the terms of the Creative Commons Attribution License (https://creativecommons.org/licenses/by/4.0/), which permits unrestricted use, distribution, and reproduction in any medium, provided the original work, first published in the Journal of Medical Internet Research, is properly cited. The complete bibliographic information, a link to the original publication on http://www.jmir.org/, as well as this copyright and license information must be included.
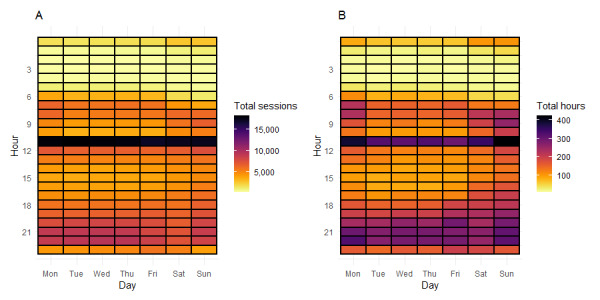
Figure 1.

Heat maps of total frequency of use (sessions) and total time on app (hours).
