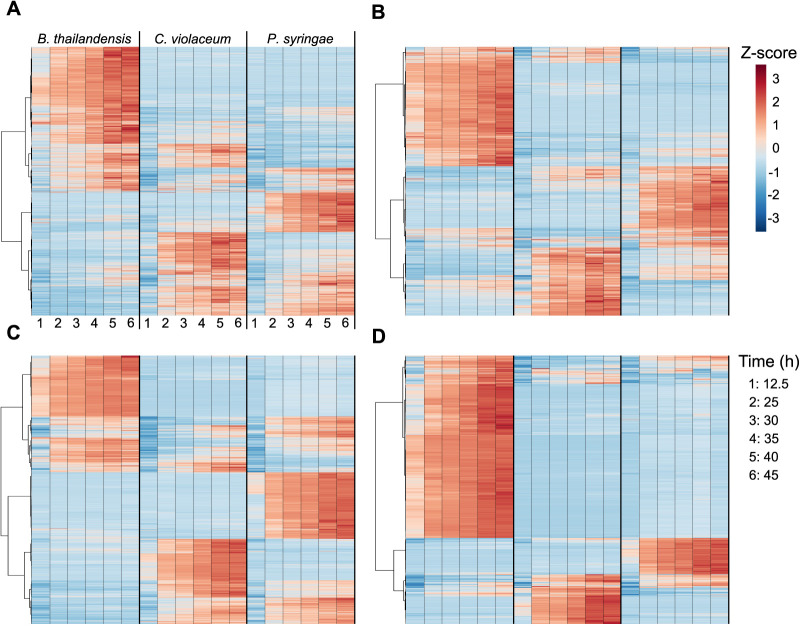
FIG 3.
Released exometabolites and their temporal dynamics. A heat map of all released exometabolites is shown for polar positive (A), polar negative (B), nonpolar positive (C), and nonpolar negative (D) modes, where samples are in columns and exometabolites are in rows. Data for each sample are the averages from independent time point replicates (n = 2 to 4). Euclidean distance was calculated from Z-scored mass spectral profiles (containing peak areas). Prior to Z-scoring, features were normalized by an ITSD reference feature and cube root transformed. Features were clustered by Ward’s method.

