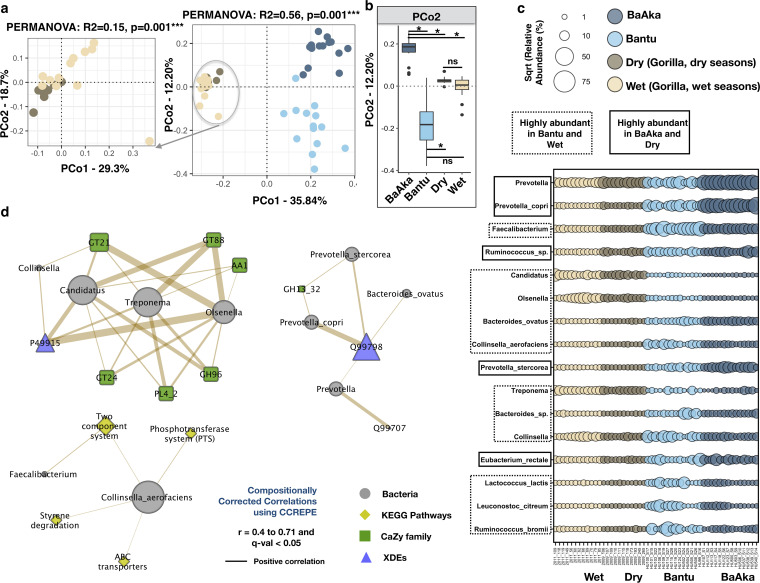
FIG 4.
Taxonomic abundances in the gut microbiome of gorilla across two seasons of variable dietary intake and of humans under two different subsistence strategies. Taxonomic assignments obtained from shotgun metagenomic data were used for this analysis. (a) Principal-coordinate analysis using Bray-Curtis distances generated from the relative abundances of bacterial taxa (NCBI plus HMP) shows distinctions in the microbial composition of gorillas across dry and wet seasons and between BaAka hunter-gatherers and Bantu agriculturalists (PERMANOVA: R2 = 0.56, P = 0.001***) and gorillas during dry versus wet seasons separately (left graph, PERMANOVA: R2 = 0.15, P = 0.001***). The amplified ordination panel on the left specifically shows distinctions in the microbial composition between gorillas across seasons (PERMANOVA: R2 = 0.15, P = 0.01**). (b) Ordination scores along PCo2 did not show similarity in BaAka hunter-gatherers or Bantu agriculturalists with gorillas in dry or wet seasons. (c) Bubble plot of discriminating taxa selected using indicator species analysis (total mean relative abundance > 1%, indval > 0.4 and P < 0.05). (d) Correlation network analysis between significantly discriminating bacterial taxa and functional profiles. The plot was constructed in CytoScape using positive compositionally corrected correlations (0.4 < r < 0.71 and q value < 0.05) calculated using CCREPE. Symbols and colors represent different microbial nodes, whereas edge patterns represent the strength and direction of correlation. The color key at the top of panel c applies to all panels. ns, not significant; *, P < 0.05; **, P < 0.01.

