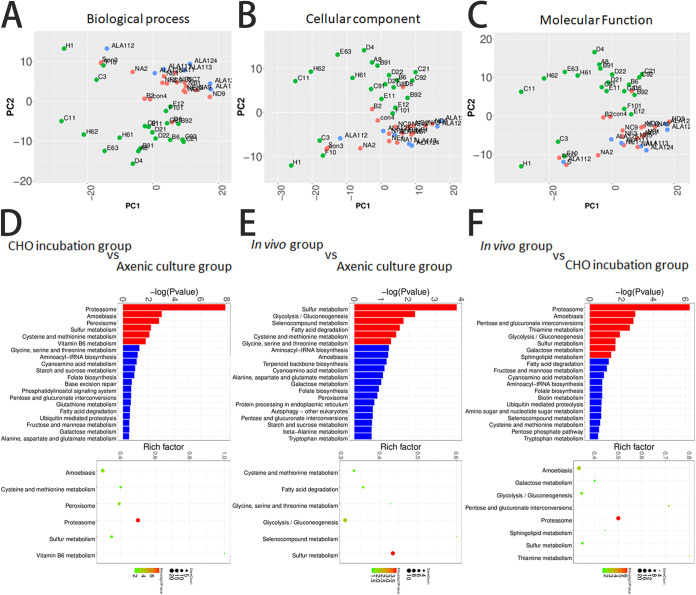
FIG 4.
KEGG pathway classification of transcriptional variation in single trophozoites from three groups in scRNA-seq analysis. Principal-component analysis of single trophozoites by using differentially expressed genes classified for biological process (A), cellular component (B), and molecular function (C). Single trophozoites of axenic culture, CHO incubation, and in vivo groups are marked in red, green, and blue, respectively. Condensed gene ontology analysis of upregulated and downregulated genes comparing CHO incubation group versus axenic culture group (D), in vivo group versus axenic culture group (E), and in vivo group versus CHO incubation group (F). (D to F) Bar charts displaying upregulated (red) or downregulated (blue) genes in the comparison group.

