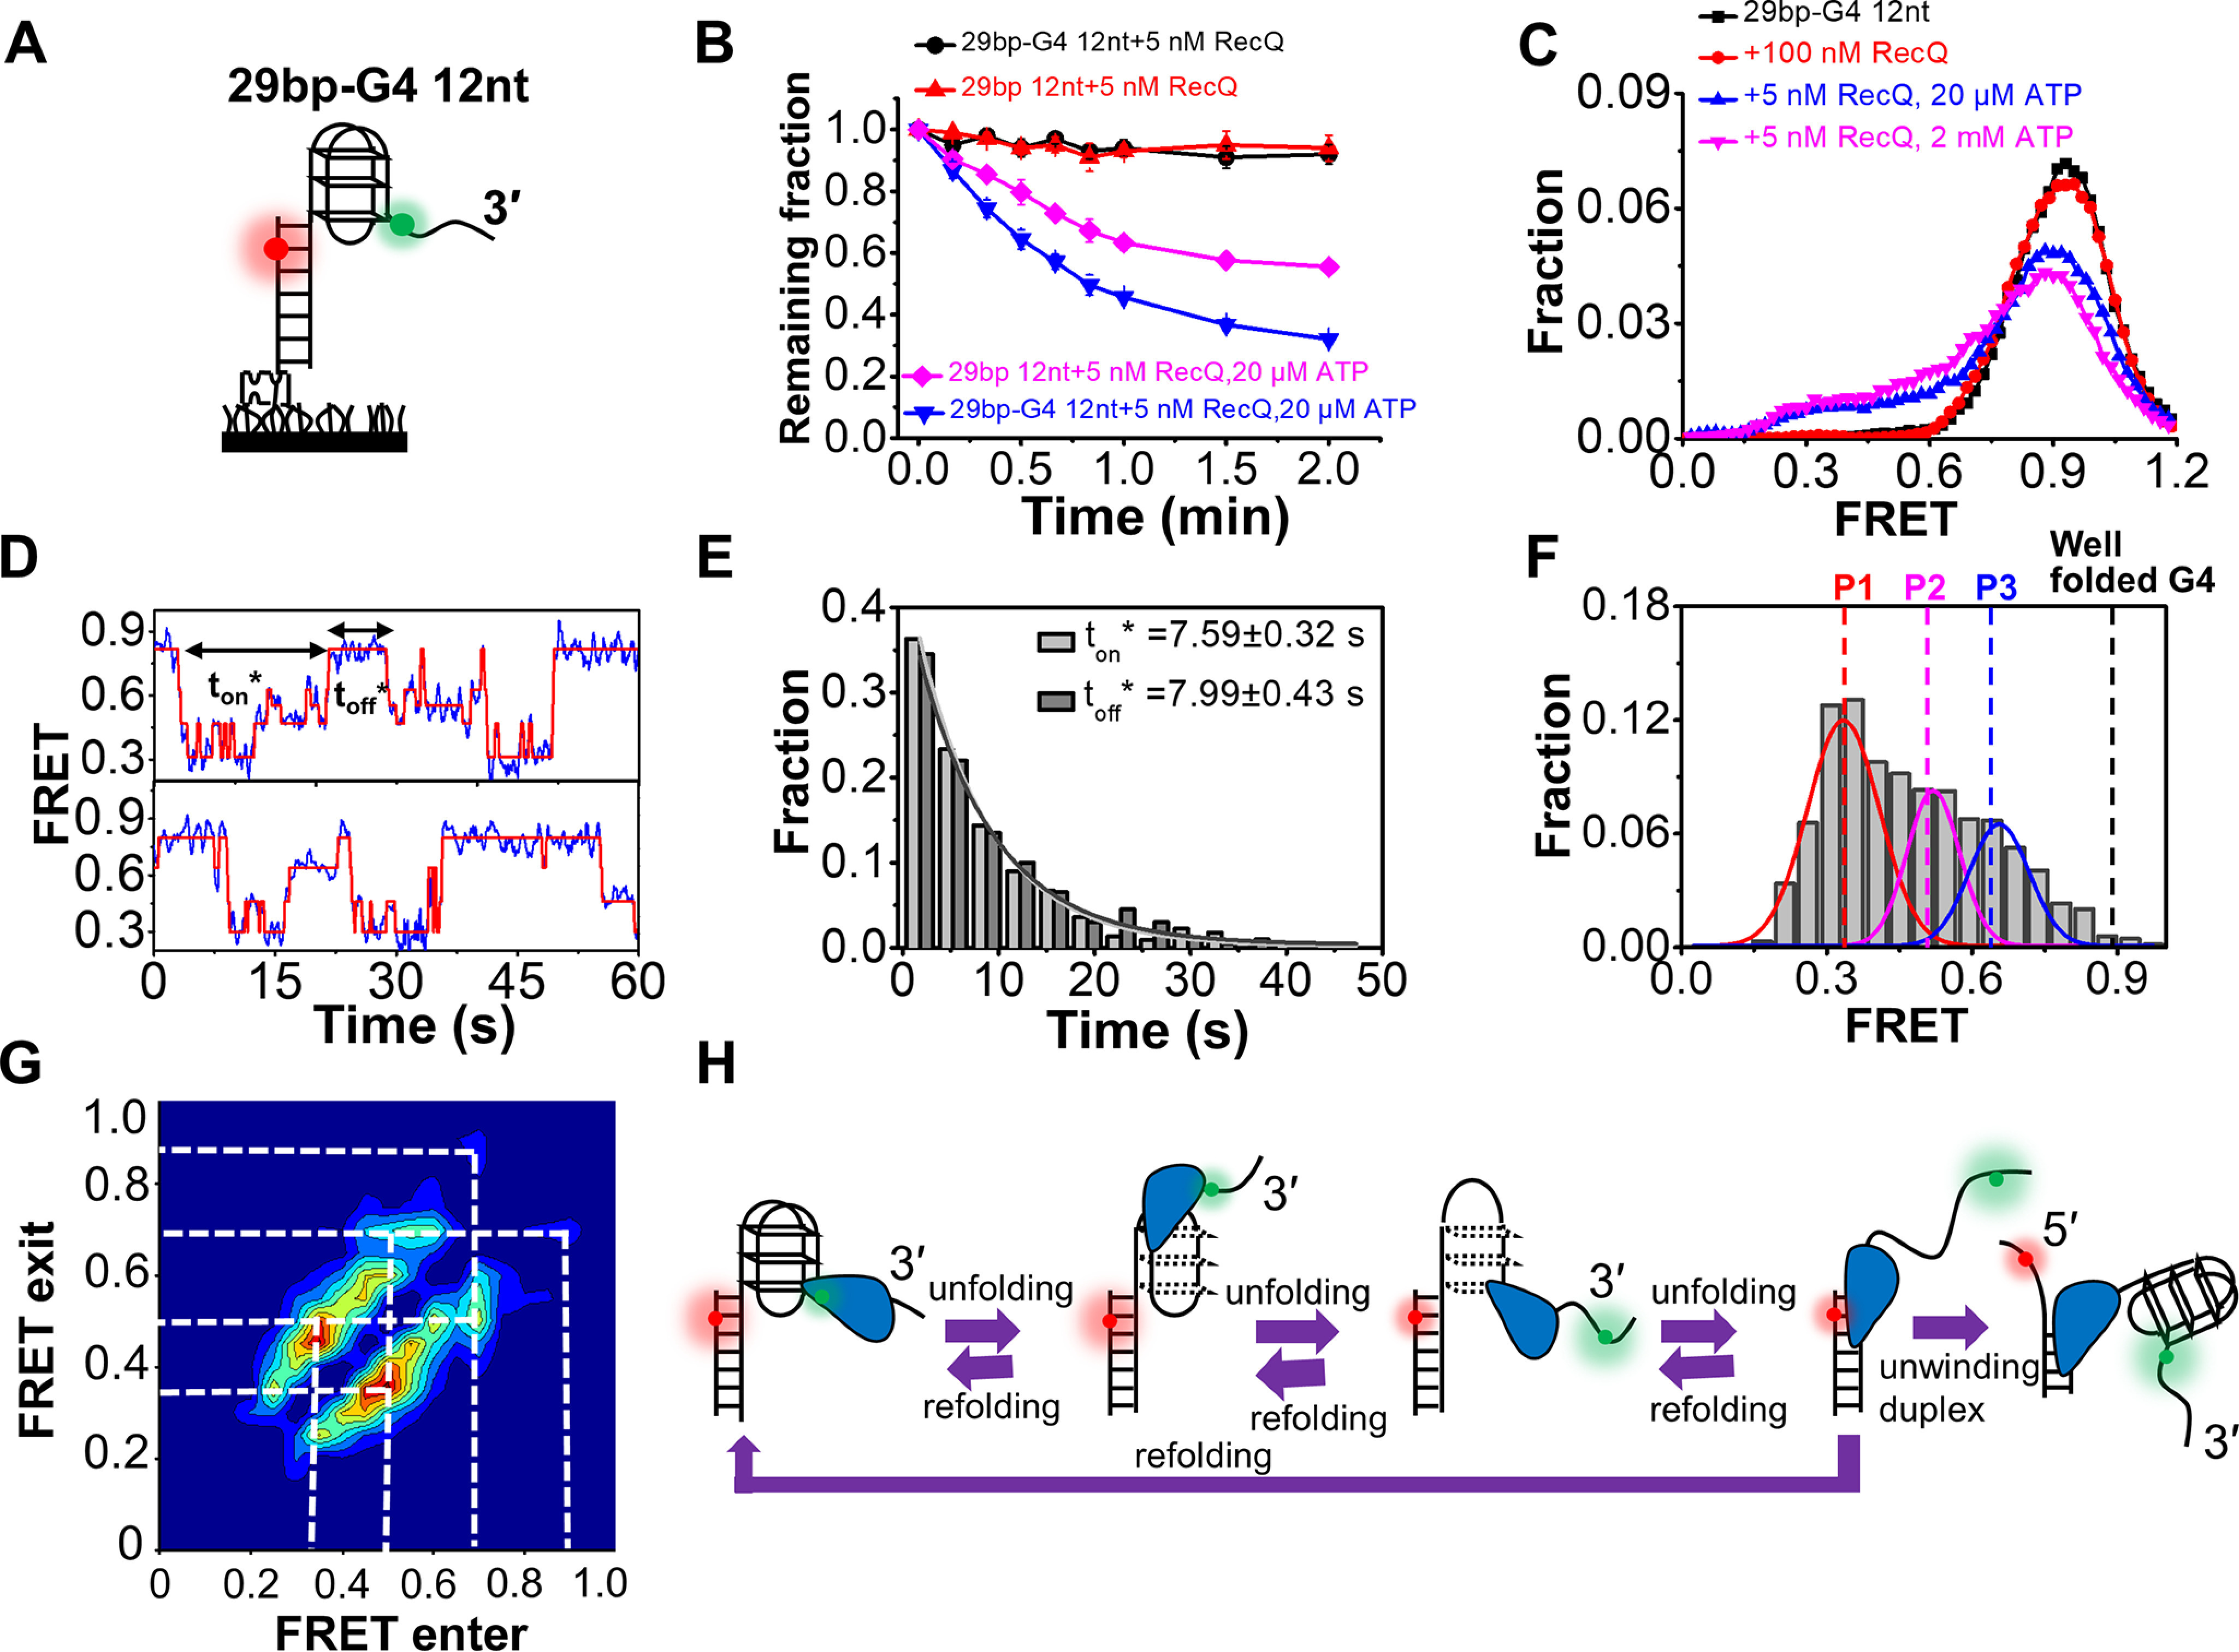
Figure 5.

RecQ can unfold the G4 DNA structure. A, the G4-containing DNA substrate 29 bp-G4 12 nt. B, fractions of remaining DNA molecules on coverslip versus time after the addition of RecQ and ATP. C, FRET distributions of G4 substrate in different concentrations of RecQ and ATP. D, in 5 nm RecQ and 20 µm ATP, the FRET values of 29 bp-G4 12 nt fluctuate between different levels. The automated step-finding algorithm was used to identify the individual steps (red line) during G4 unfolding and refolding. The time for the continuous FRET oscillations was defined as ton*, and the time interval between two lasting oscillations was defined as toff*. E, distributions of ton* and toff*. F, distributions of the FRET oscillation regions of 29 bp-G4 12 nt in 5 nm RecQ and 20 µm ATP. G, transition density plot for oscillation regions of 29 bp-G4 12 nt from ∼200 FRET oscillation regions. H, schematic diagram of our model to explain how RecQ unfolds the G4 structure repetitively.
