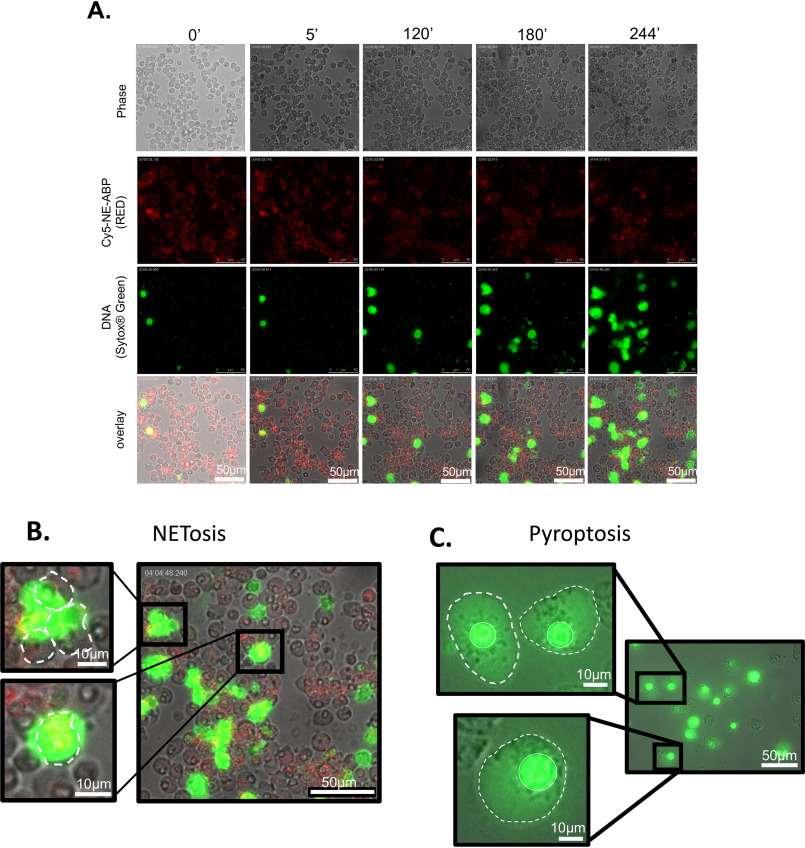
Figure 3.
NETosis versus pyroptosis. A, time course of NET formation in PMA-treated neutrophils co-incubated with a Cy5-labeled NE probe (red) and SYTOX TM Green to mark DNA. B and C, nuclear DNA is extruded in NETosis (B) and contained within the nucleus during pyroptosis induced by treatment of macrophages by LPS and ATP (C). In the images, the nucleus is marked by a continuous white line and the cell membrane with a dashed line. Panel B intentionally duplicates the 244 min time point image from panel A to provide an enlarged display of the field captured in the image.

