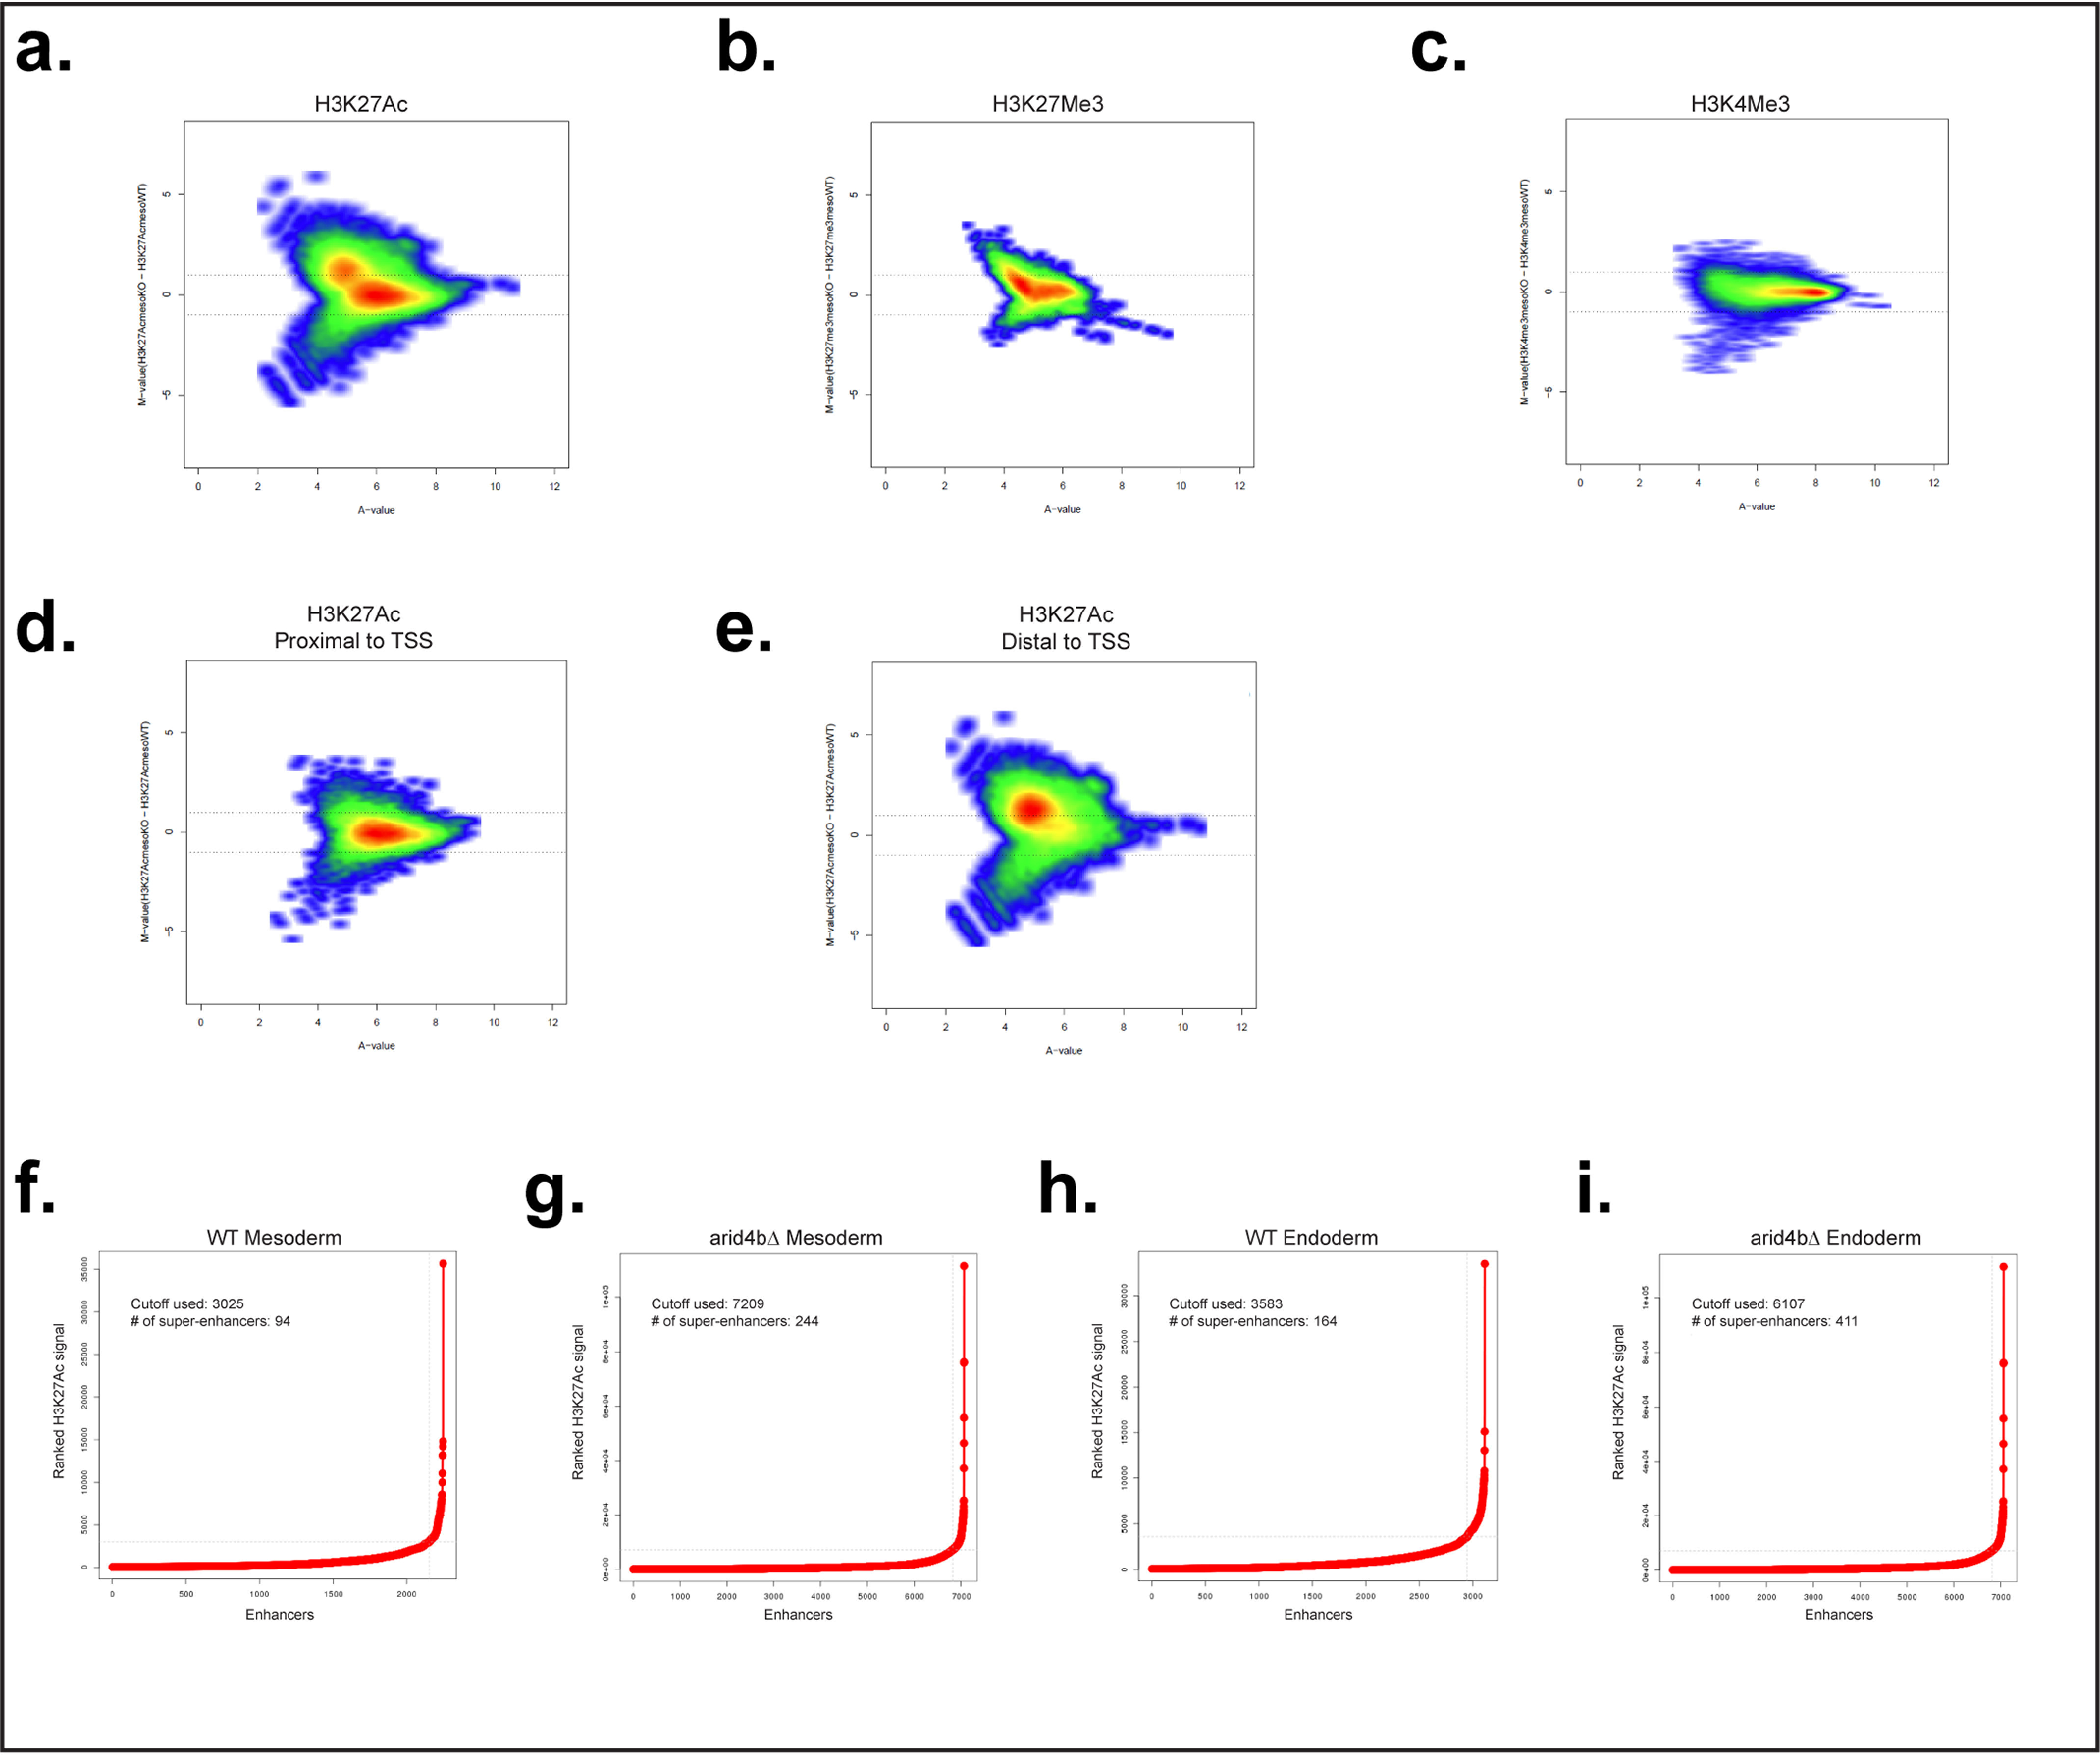
Figure 4.

Global chromatin landscape changes that result from ARID4B loss. a–c, MA plot for H3K27Ac (a), H3K27Me3 (b), and H3K4Me3 (c) in mesoderm-directed WT and arid4bΔ cells. Each point represents a genomic location for the signal. d and e, MA plot for H3K27Ac signal segregated based on distance to TSS (proximal, d; distal, e). f–i, H3K27Ac signal plots to identify super-enhancers for WT (f and h) and arid4bΔ (g and i) cells for mesoderm (f and g) and endoderm (h and i) lineages, x axis shows the ranked H3K27Ac signal, y axis shows the enhancers. The inflection point cutoff value of H3K27Ac signal as well as the number of identified super-enhancers are shown in each graph.
