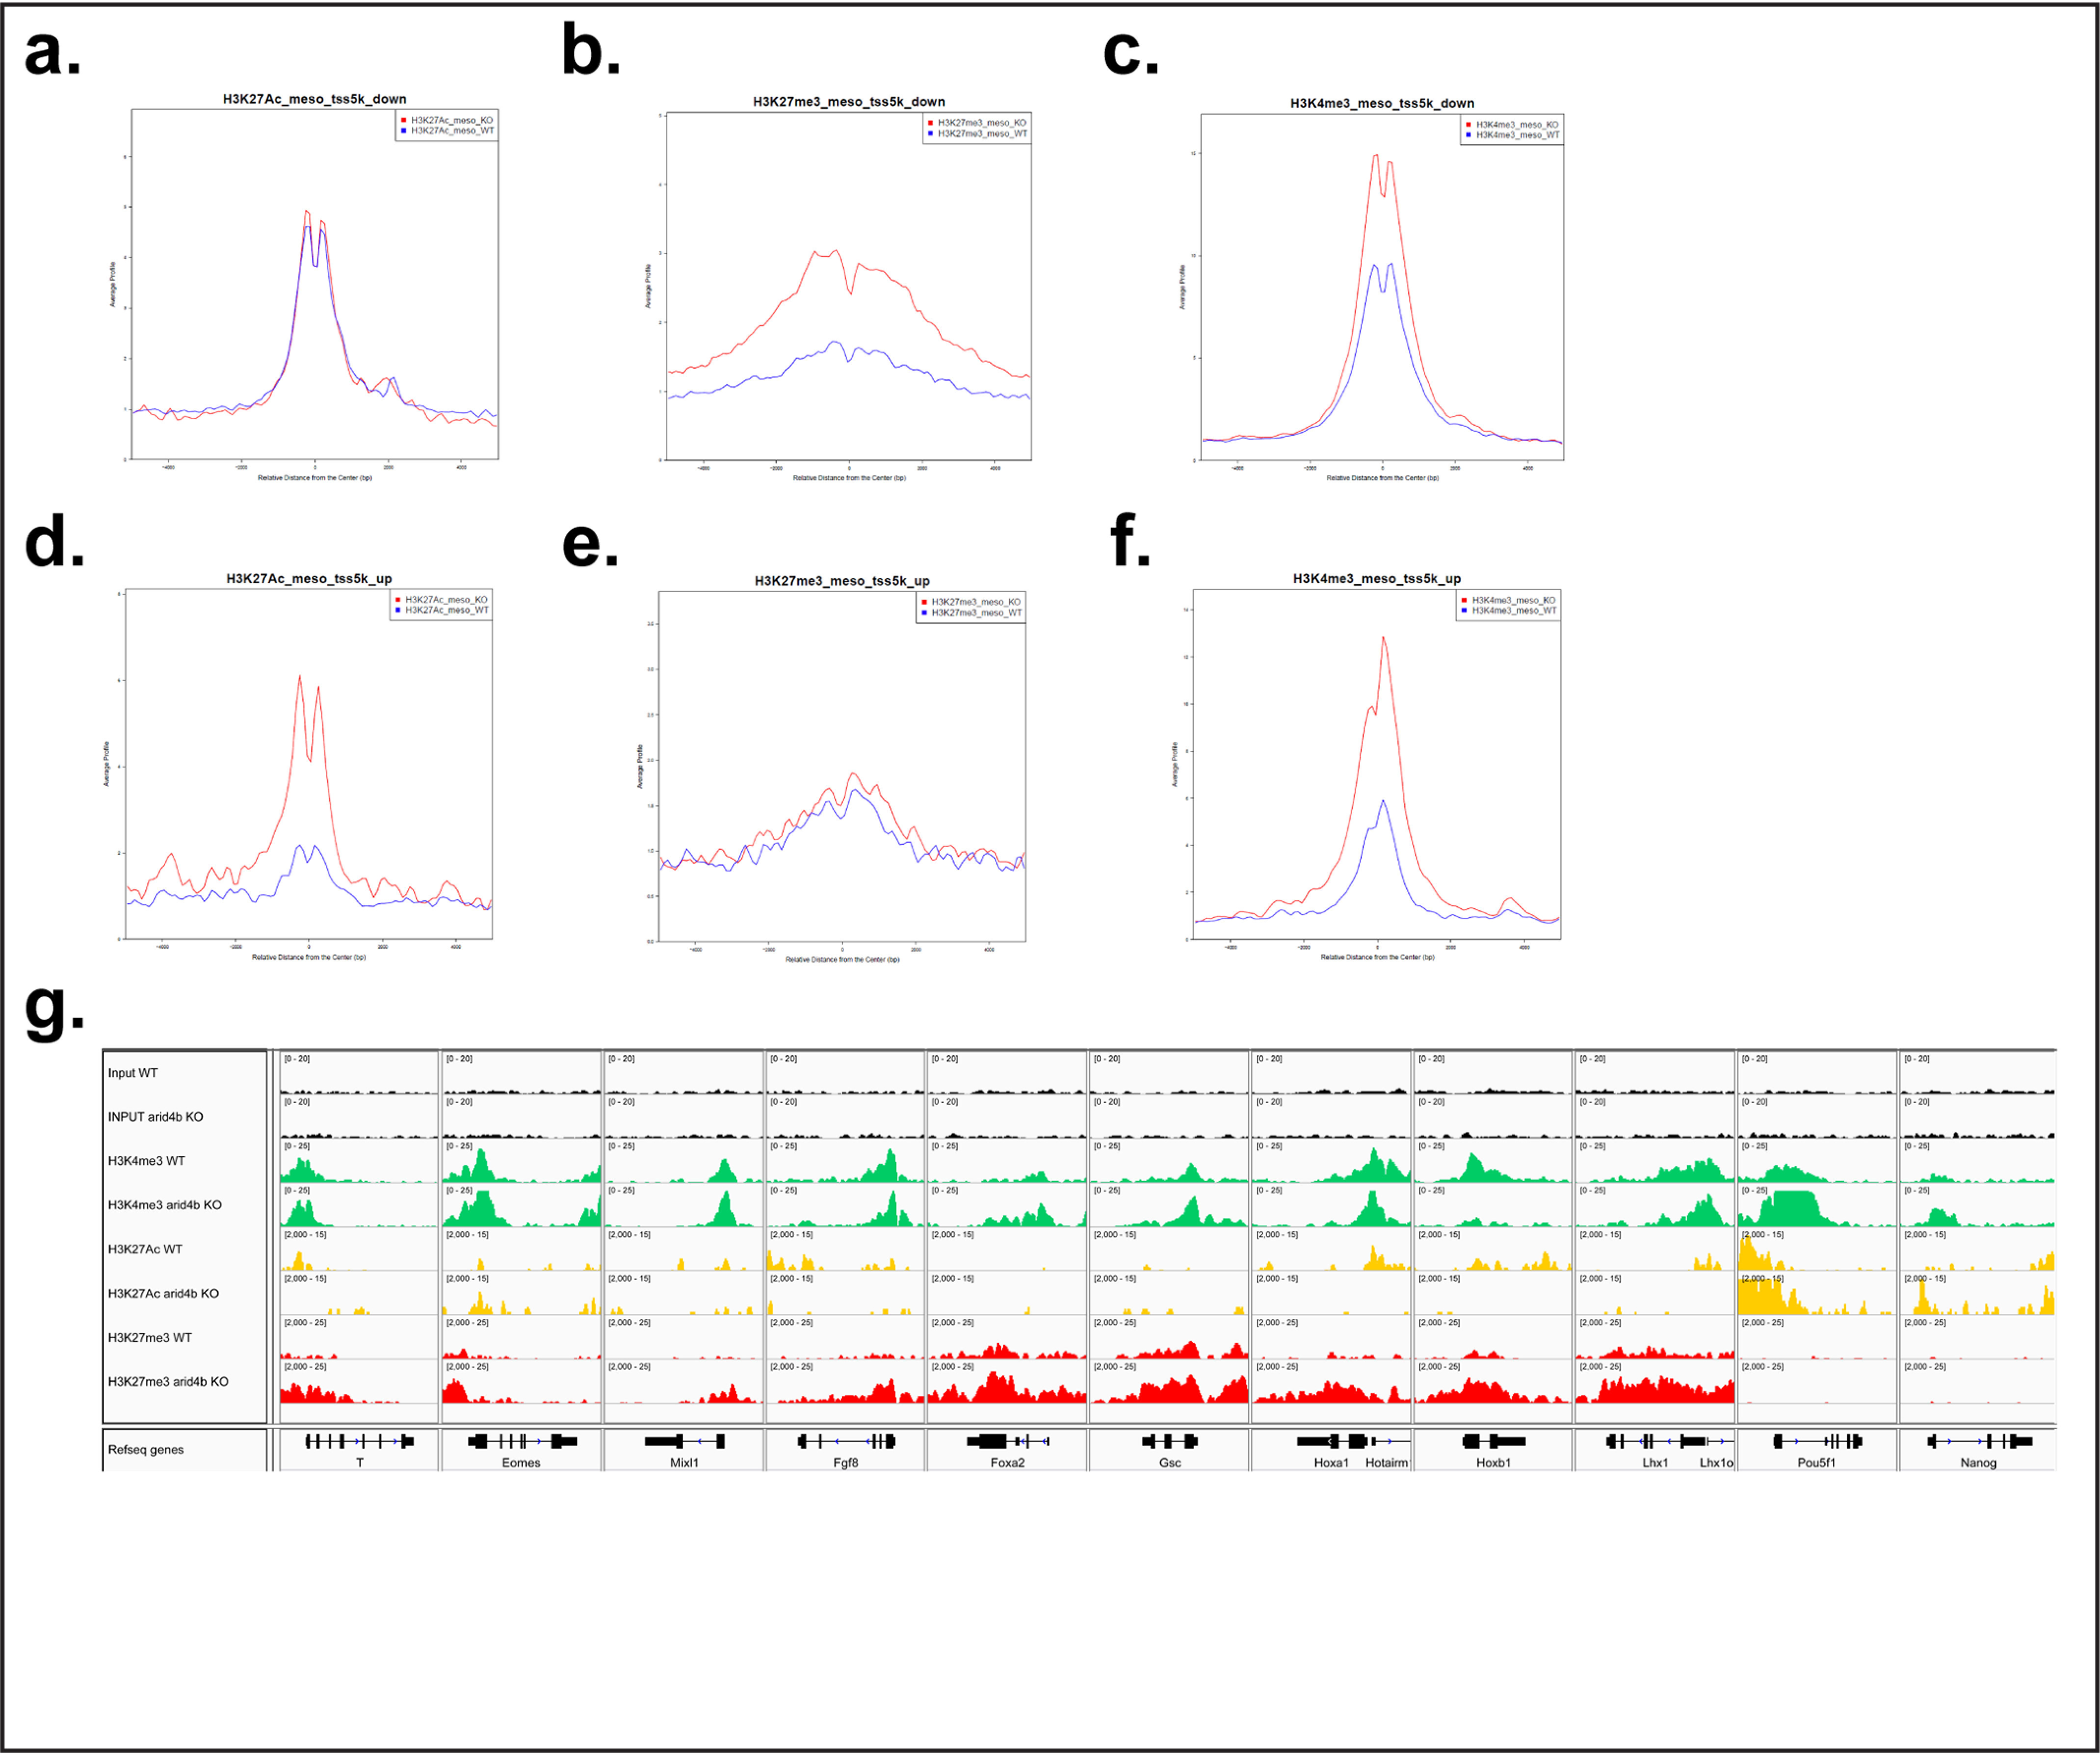
Figure 5.

Chromatin changes relevant to lineage markers in arid4bΔ cells. a–c, Sitepro analysis of H3K27Ac (a), H3K27Me3 (b), and H3K4Me3 (c) ChlP-seq on transcriptionally down-regulated genes in mesoderm-directed WT (blue) and arid4bΔ (red) cells. x axis, average signal profile; y axis, relative distance from the center (TSS). d–f, Sitepro analysis of H3K27Ac (d), H3K27Me3 (e), and H3K4Me3 (f) ChlP-seq on transcriptionally up-regulated genes in mesoderm-directed WT (blue) and arid4bΔ (red) cells. x axis, average signal profile; y axis, relative distance from the center (TSS). g, Integrative Genomics Viewer visualization of ChlP-seq tracks for selected lineage specific genes (Bry, Eomes, Mixl1, Fgf8, Foxa2, Gsc, Hoxa1, Hoxb1, and Lhx1) and ESC specific genes (Oct4 (Pou5f1), Nanog) in mesoderm-directed WT and arid4bΔ cells. y axes of WT and arid4bΔ tracks are set to the same data range.
