Figure 4.
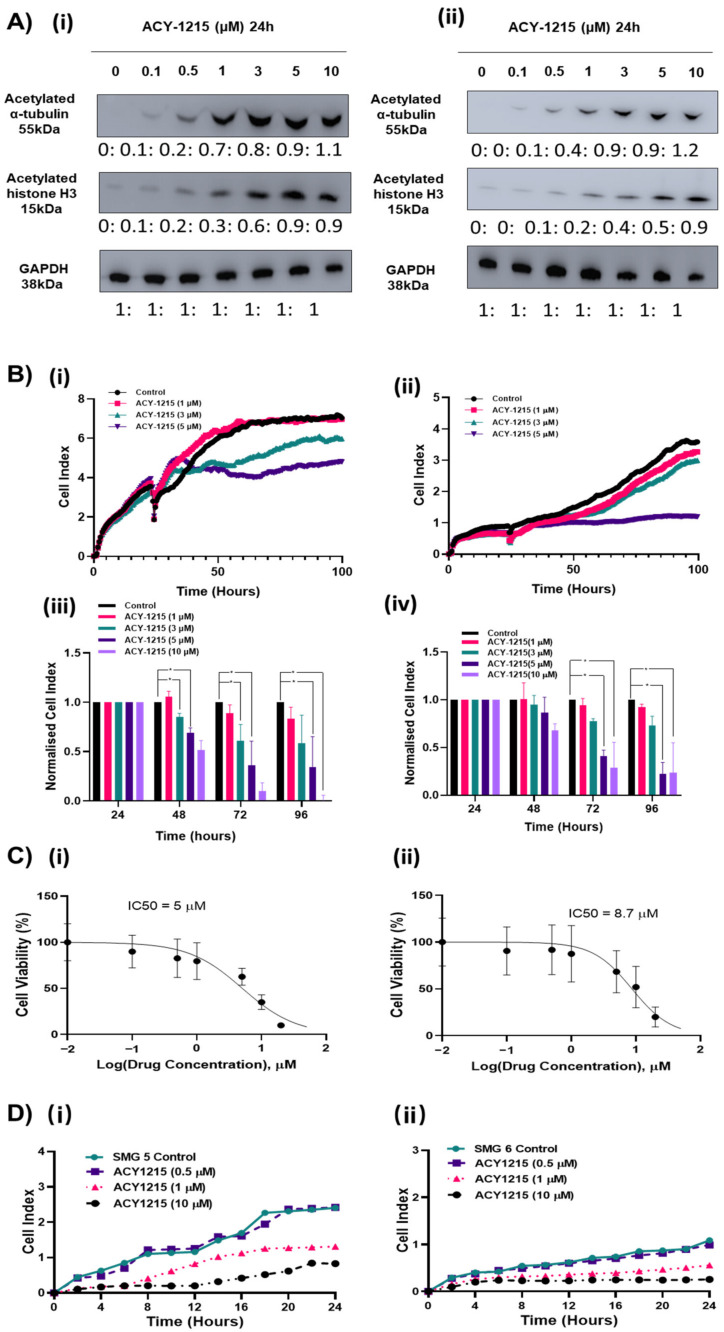
Low concentrations of the HDAC6 inhibitor ACY-1215 increased acetylated α-tubulin without affecting cell proliferation and viability. (A) SMG5 (i) and SMG6 (ii) cells treated with 1–10 μM of ACY-1215 for 24 h and α-tubulin and H3 levels were measured by western blot analysis. GAPDH was used as a loading control (n = 3). Uncropped Western Blots are available in Figures S8 and S9. (B) (i),(ii) Representative graphs from the real time xCELLigence proliferation system comparing growth profiles of SMG cells after treated with 1–10 μM ACY-1215. (iii),(iv) Cell index values were normalized to both 24 h and control, observing the rate of proliferation (24–96 h). Wells were analyzed in duplicate, and three biological replicates were performed to validate results. Experiments were analyzed by a two-way ANOVA. * p < 0.05. Error bars represent SEM. (i),(iii) SMG5, (ii),(iv) SMG6. (C) SMG5 (C): (i) and SMG6 (ii) cells treated with 0–50 μM ACY-1215 and cell viability was measured using 3-(4,5-dimethylthiazol-2-yl)-2,5-diphenyl-2H-tetrazolium bromide-MTT assay (n = 3). (D) Representative graphs from the real time xCELLigence migration system comparing growth profiles of SMG5 (i) and SMG6 (ii) cells following pre-treatment with 1 or 10 μM ACY-1215. Wells were analyzed in duplicate, and three biological replicates were performed to validate results.

