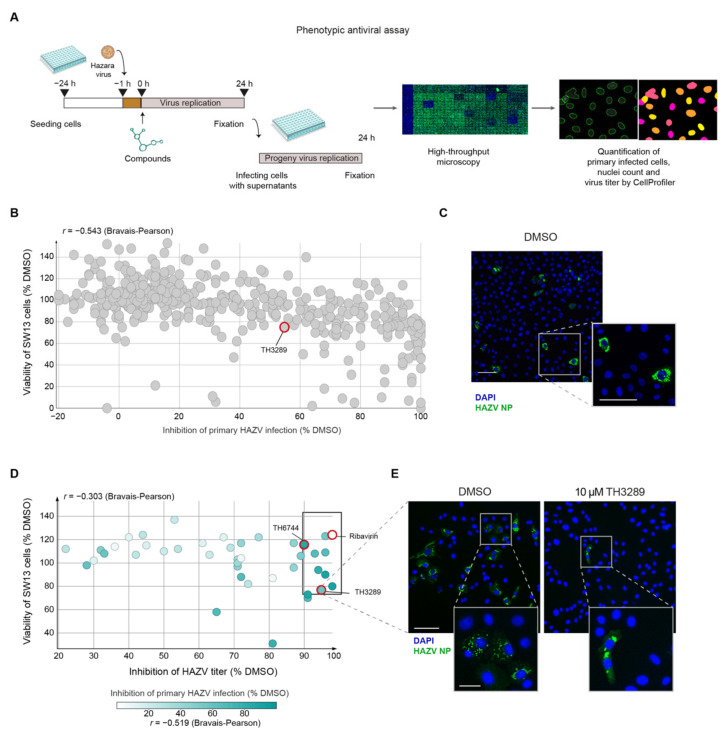
Figure 1.
Discovery of several novel antiviral compounds by an image-based phenotypic Hazara virus (HAZV) screen. (A) Schematic overview of phenotypic antiviral screening cascade of small molecule compounds, evaluating nuclei count as an indicator of compound toxicity, level of HAZV infection in cells by HAZV nucleoprotein (NP) antibody staining (primary infection) and HAZV progeny release by end-point dilution assay (virus titer). Automated image analysis was performed. (B–E), SW13 cells were infected with HAZV (MOI 10) and treated with 10 μM of compounds from the in-house library for 24 h. Cells were stained for DAPI (blue) and HAZV NP (green) and analyzed by high-throughput microscopy. Data are presented as a mean of two technical replicates per compound performed in n = 1 biological replicate. (B) In primary infection screen, % inhibition of HAZV infection was determined based on HAZV NP and DAPI signal relative to DMSO. Viability of SW13 cells was based on nuclei count relative to DMSO. (C) Representative images of HAZV infected SW13 cells. DAPI in blue and HAZV NP in green. Scale bars equal 100 μm. (D) Virus titer from supernatant was determined by end-point dilution assay on Vero cells and quantified by automated image analysis. Viability of SW13 cells was based on nuclei count relative to DMSO from the primary infection screen. (E) A representative image of HAZV infected Vero cells treated with DMSO or 10 µM TH3289. DAPI in blue and HAZV NP in green. The upper image scale bar equals 100 μm, the lower image scale bar equals 20 μm.

