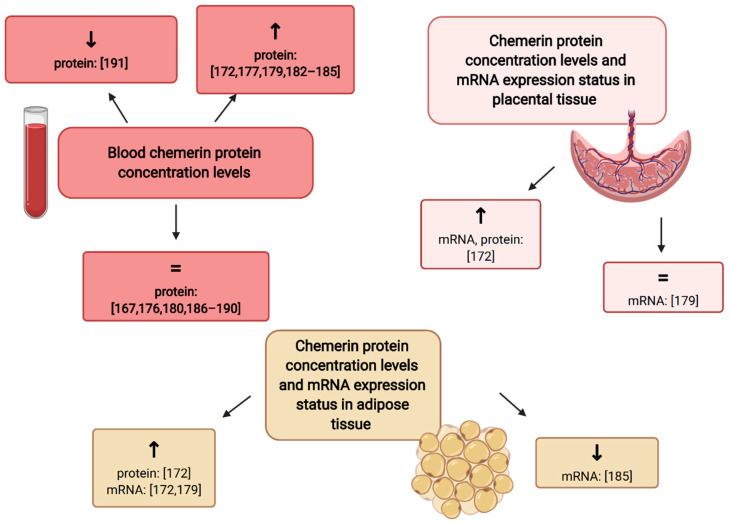
Figure 2.
The graphical summary of data concerning chemerin concentration and chemerin mRNA expression levels in GDM patients as compared to control patients. ↑ increase in parameter level as compared to control [172,177,179,182,183,184,185]; ↓ decrease in parameter level as compared to control [191]; =: no significant alterations observed as compared to control [167,176,180,186,187,188,189,190] (Created with BioRender.com).

