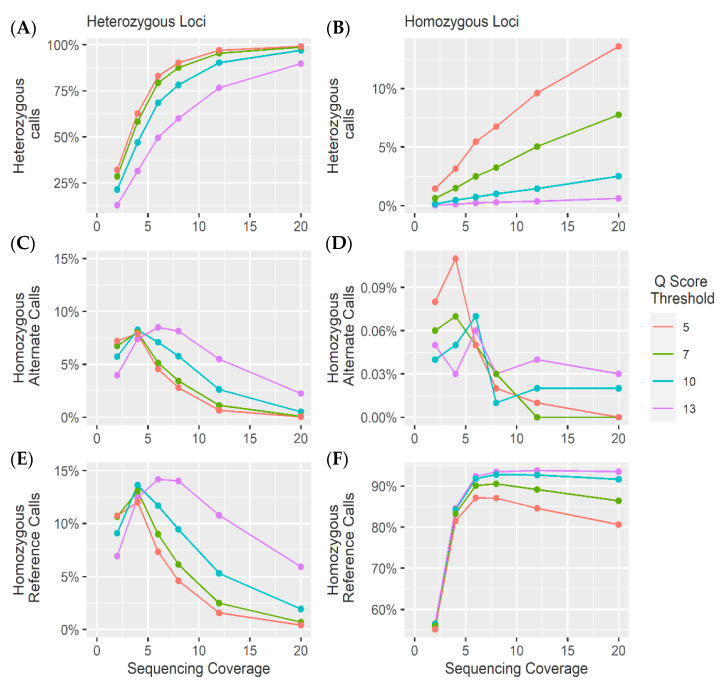
Figure 5.
Genotype calling results from the 10,000 heterozygous loci (left) and 10,000 homozygous sites (right) at different sequencing coverages. (A) The percentage of SNPs correctly identified (heterozygous). (B) The percentage of false heterozygous alternate calls. (C) The percentage of false homozygous reference calls. (D) The percentage of false homozygous alternate calls. (E) The percentage of false homozygous reference calls. (F) The percentage of accurate homozygous reference calls.

