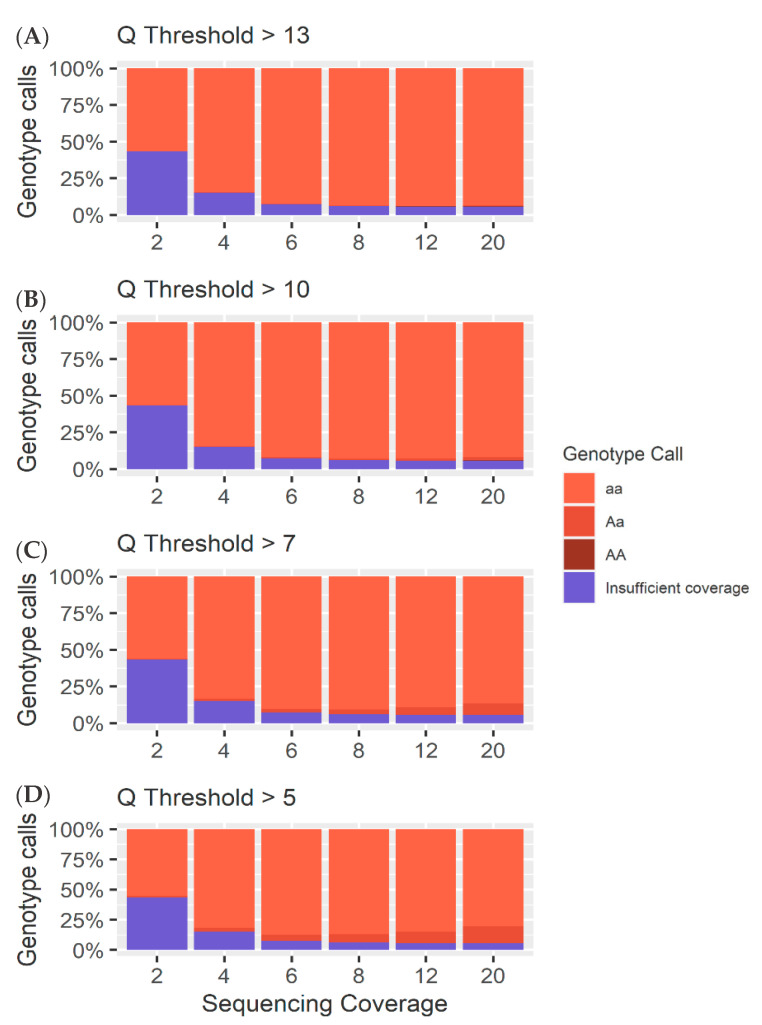
Figure 8.
(A) A breakdown of the different calls (Table S2) for each sequencing coverage at a Q threshold of 13 for the 10,000 homozygous loci. (B) A breakdown of the different calls (Table S2) for each sequencing coverage at a Q threshold of 10 for the 10,000 homozygous loci. (C) A breakdown of the different calls (Table S2) for each sequencing coverage at a Q threshold of 7 for the 10,000 homozygous loci. (D) A breakdown of the different calls (Table S2) for each sequencing coverage at a Q threshold of 5 for the 10,000 homozygous loci.

