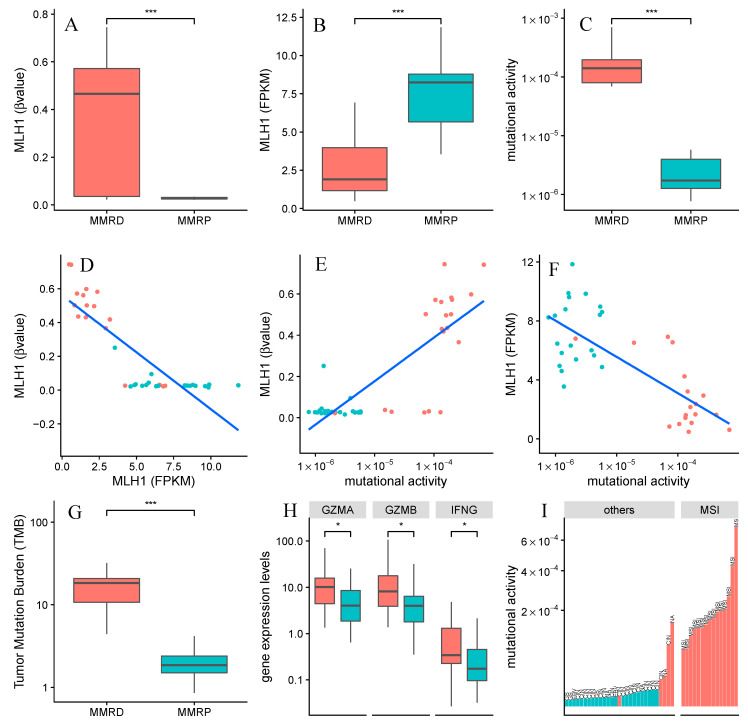
Figure 6.
MMR (mismatch repair)-associated molecular drivers. This figure shows the molecular interplay among the MMRD and MMRP predicted groups, which are colored in red and blue, respectively. (A) Changes in methylation of MLH1 promoter, (B) MLH1 expression levels and (C) mutational activity of Signature 20 were detected by comparing MMRD and MMRP groups; Scatterplots showing (D) methylation and gene expression levels of MLH1, (E) methylation levels of MLH1 and mutational activity of Signature 20, (F) gene expression levels of MLH1 and mutational activity of Signature 20; (G) Changes of Tumor Mutation Burden and (H) genes related to pro-inflammatory markers across MMRD and MMRP groups. (I) Mutational activity of Signature 20 across MSI subtype and others molecular subtypes. Statistical significance was assessed by the two-tailed Wilcoxon Rank Sum and it is indicated by * p < 0.05, *** p < 0.001. The MSI (Microsatellite Instability) and other subtypes (GS: Genomically Stable; EBV: EBV-positive and CIN: Chromosomal INstability) were collected from The Cancer Genome Atlas (TCGA) study.

