Figure 3.
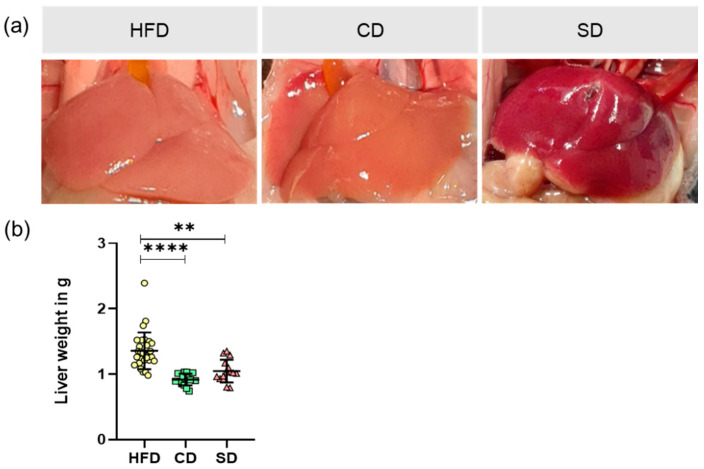
(a) Representative in situ images of mice livers from mice fed high fat diet (HFD), control diet (CD) or standard diet (SD); (b) Liver weight of the different groups (HFD: n = 29; CD: n = 15, SD: n = 15) presented as mean ± standard deviation. Significance of differences between the groups was tested by one-way ANOVA on Ranks (Kruskal–Wallis); **** p < 0.0001, ** p < 0.01.

