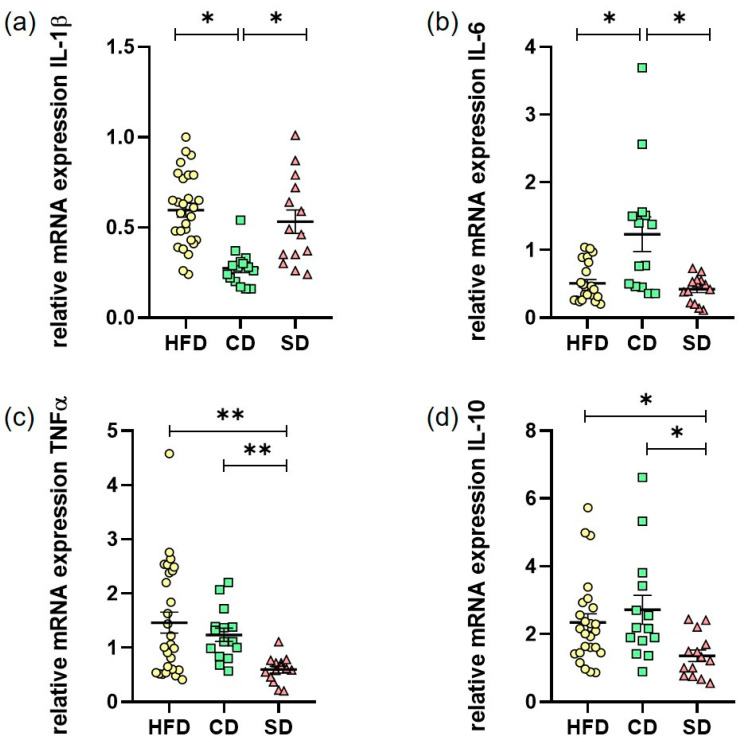
Figure 7.
(a) Hepatic mRNA expression in the high fat diet (HFD), control diet (CD) or standard diet (SD) group of IL-1β (HFD: n = 28, CD: n = 14, SD: n = 14); (b) Hepatic mRNA expression of IL-6 (HFD: n = 24, CD: n = 15, SD: n = 14); (c) Hepatic mRNA expression of TNFα (HFD: n = 28, CD: n = 15, SD: n = 14); (d) Hepatic mRNA expression of IL-10 (HFD: n = 25, CD: n = 15, SD: n = 14). Data presented as 2−ΔΔCt values determined by quantitative real-time PCR; Data presented as mean ± standard deviation. Significance of differences between the groups was tested by ordinary one-way ANOVA in (a) or one-way ANOVA on Ranks (Kruskal–Wallis) in (b–d) or; ** p < 0.01, * p < 0.05.

