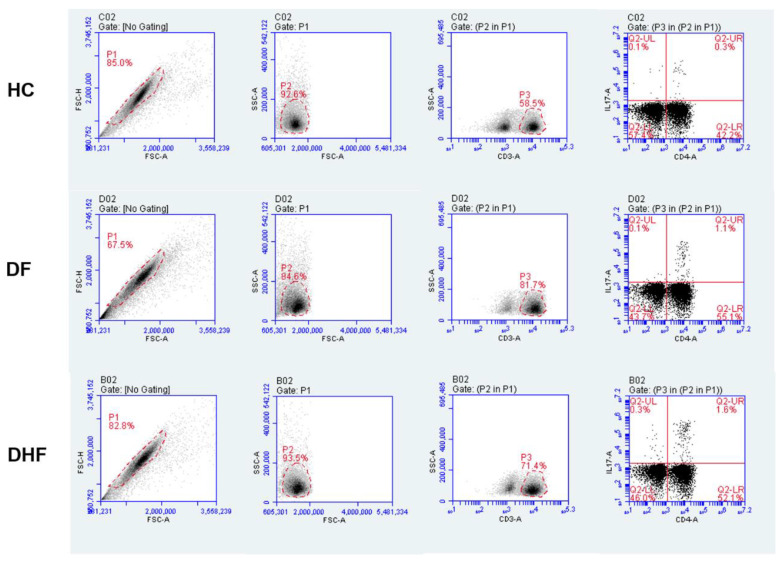
Figure 5.
Strategy for IL-17-producing cell analysis. Dot plots are representative of one HC, DF and DHF patient. Ten thousand events were acquired from lymphocyte regions based on CD3-FITC staining. Percentages of IL-17-producing cells were identified in the CD4+ and CD4- region with the quadrants established based on isotype controls. CD3+ CD4+ IL-17+ cells were considered to be Th17 cells mainly.

