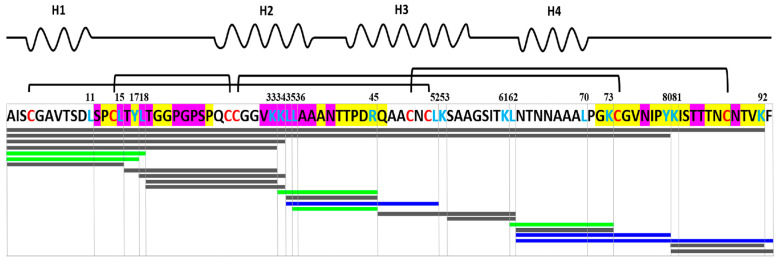
Figure 5.
Peptide profiling of rLen c 3 gastric and subsequent duodenal digestion for 2 h. Peptides identified by mass spectrometry are shown as blue (rLen c 3 alone), green (rLen c 3 with LPPG), and gray (in both cases) bars. The key amino acid residues identified as cleavage sites are marked in blue. The residues forming three linear epitopes of Pru p 3 are colored in yellow (matching) and magenta (not matching). Location of four α-helices H1–H4 (PDB ID: 5LQV) is shown at the top of the figure.

