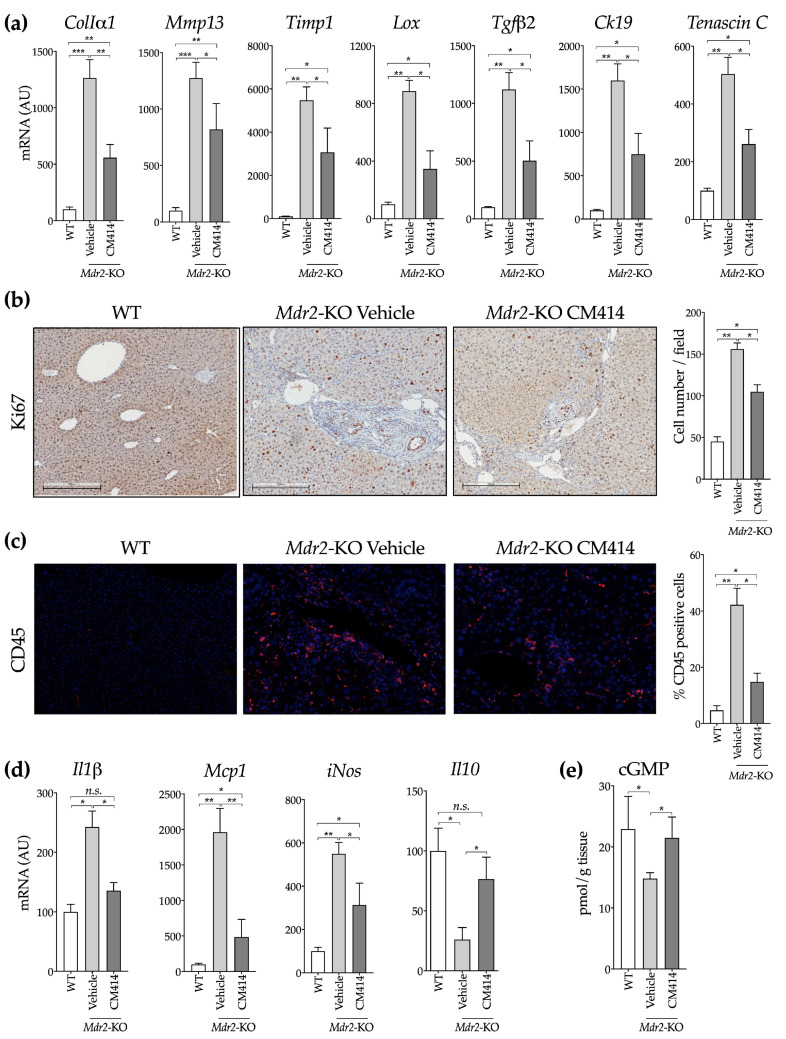
Figure 4.
Evaluation of inflammation, fibrosis, and cell proliferation-related markers in the liver of WT, vehicle-treated Mdr2-KO, and CM414-treated Mdr2-KO mice. (a) qPCR analyses of the hepatic expression of fibrogenic activation-related genes. (b) representative immunohistochemical staining of Ki67 in liver sections. Graph on the right shows the quantification of Ki67 positive cells. (c) representative immunofluorescent staining of CD45 in liver sections. Graph on the right shows the quantification of CD45 positive cells. (d) qPCR analyses of the hepatic expression of inflammation-related genes. (e) analysis of cyclic guanosine monophosphate (cGMP) levels in mouse liver tissues. * p < 0.05. ** p < 0.01. *** p < 0.001.

